
Hello guys,
the EUR/USD has been in a really strong uptrend since April. It is pretty clear that strong Buyers are dominating and pushing the price higher and higher.
But, the price is getting close to a very strong Resistance now. A Resistance I have marked in my charts for 2 years now!
Does it bother me that the resistance is too old? Not in the slightest! Markets have good memory. I am 100% sure that big institutional traders are well aware of this place and they are getting ready!
So, where is this Resistance I keep talking about? It is around the 1.2300 zone.
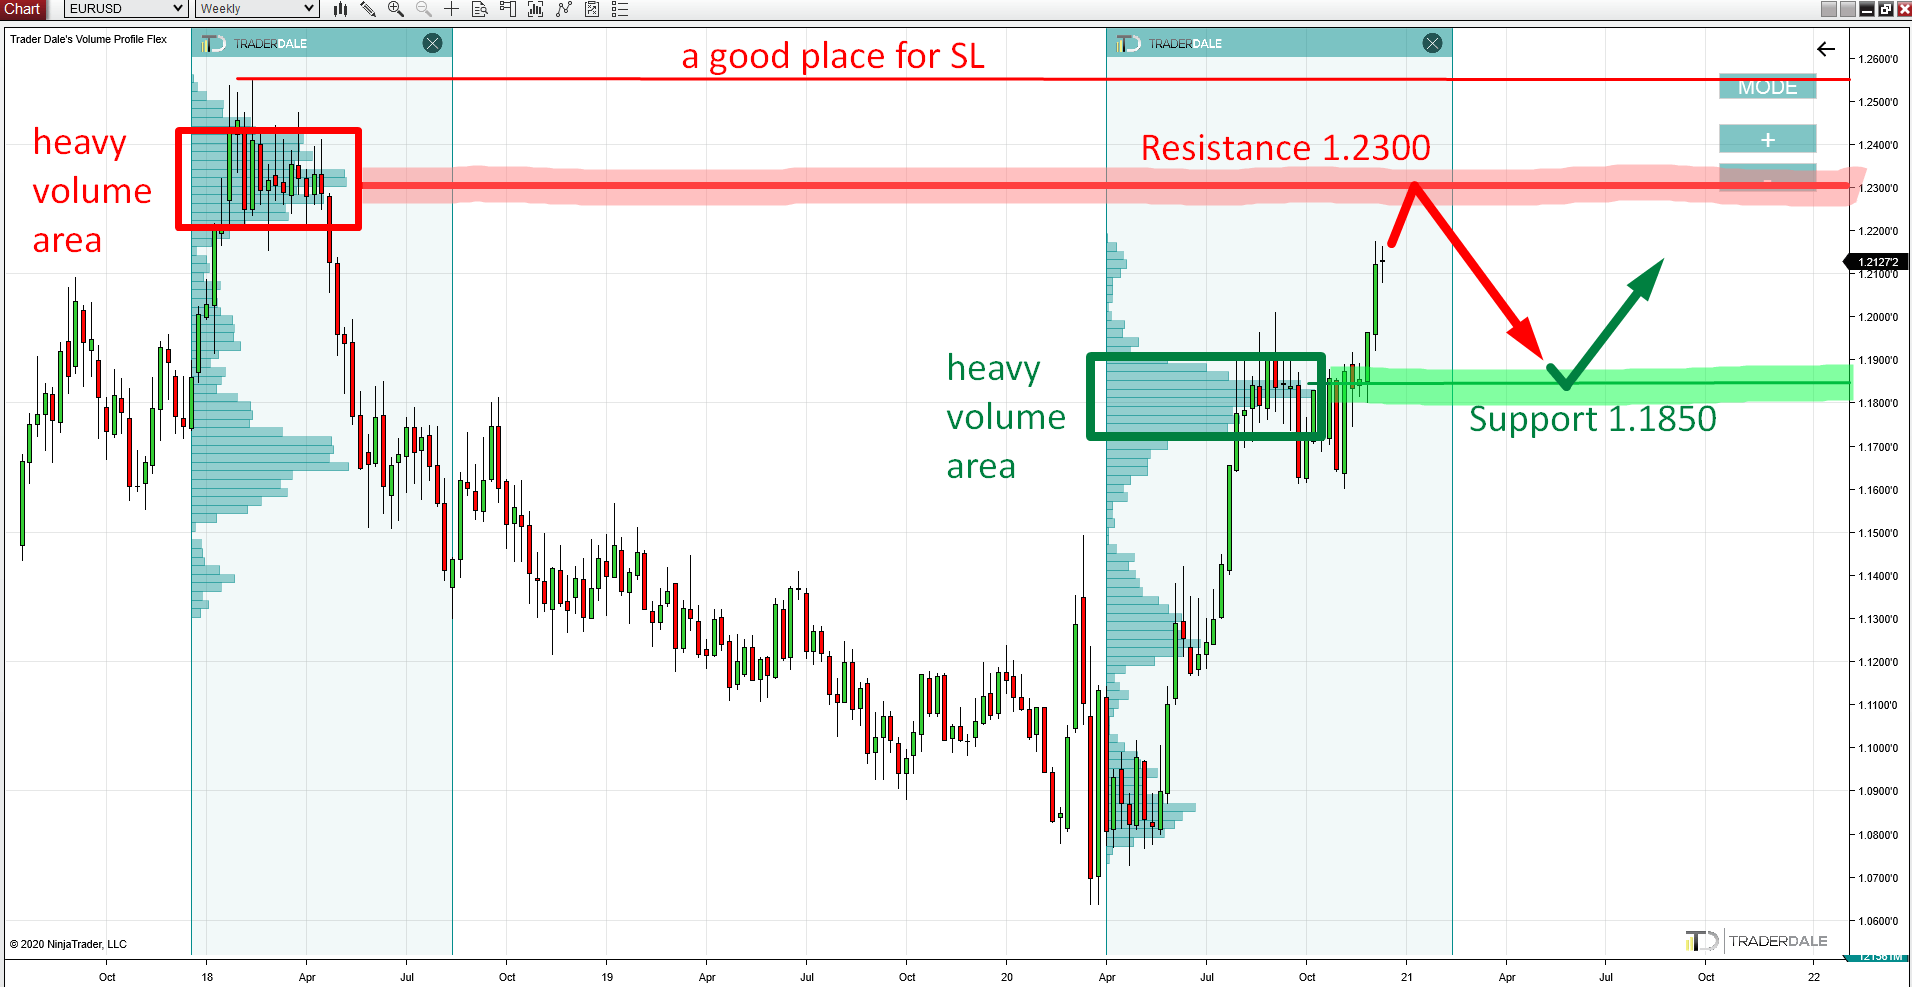
In 2018, there was a really strong rejection of higher prices. If you use Volume Profile indicator, you will see that massive volumes were traded around 1.2300. Those volumes were strong Sellers accumulating their Shorts there. From this place, the downtrend on EUR/USD started.
Currently, the price is heading towards this area again. What I expect to happen there is a strong institutional selling activity. This activity should turn the price downwards again.
EUR/USD, Weekly chart:
How to trade this?
Trading is every person’s own responsibility as they need to bear the results of their decisions themselves.
Here, I am going to show you what I consider a good way to approach trading this.
A good Short trade entry point would be at the heavy volume area around 1.2300. This is where the majority of volumes got traded.
Stop Loss would be at the high of the strong rejection from 2018 (1.2550). If a weekly candle closes past this place I don’t really see a point of still holding the Short position.
In my opinion, it would be best to trade this with the “Alternative SL Method“.
Now, what about Take Profit? Currently it seems that a good place to take the profit would be around 1.1850.
Why is that? Because there is a heavy volume area. This area was formed in the previous couple of months and it could work as a strong Support.
If you are in a Short trade from 1.2300, then by the time the price reaches this 1.1850 zone, you will have around +450 pips in open profit. It would be risky to try and hold your Shorts past this Support!
What could actually be better is to bank your profit there (or even a couple of pips sooner) and immediately enter a new Long position.
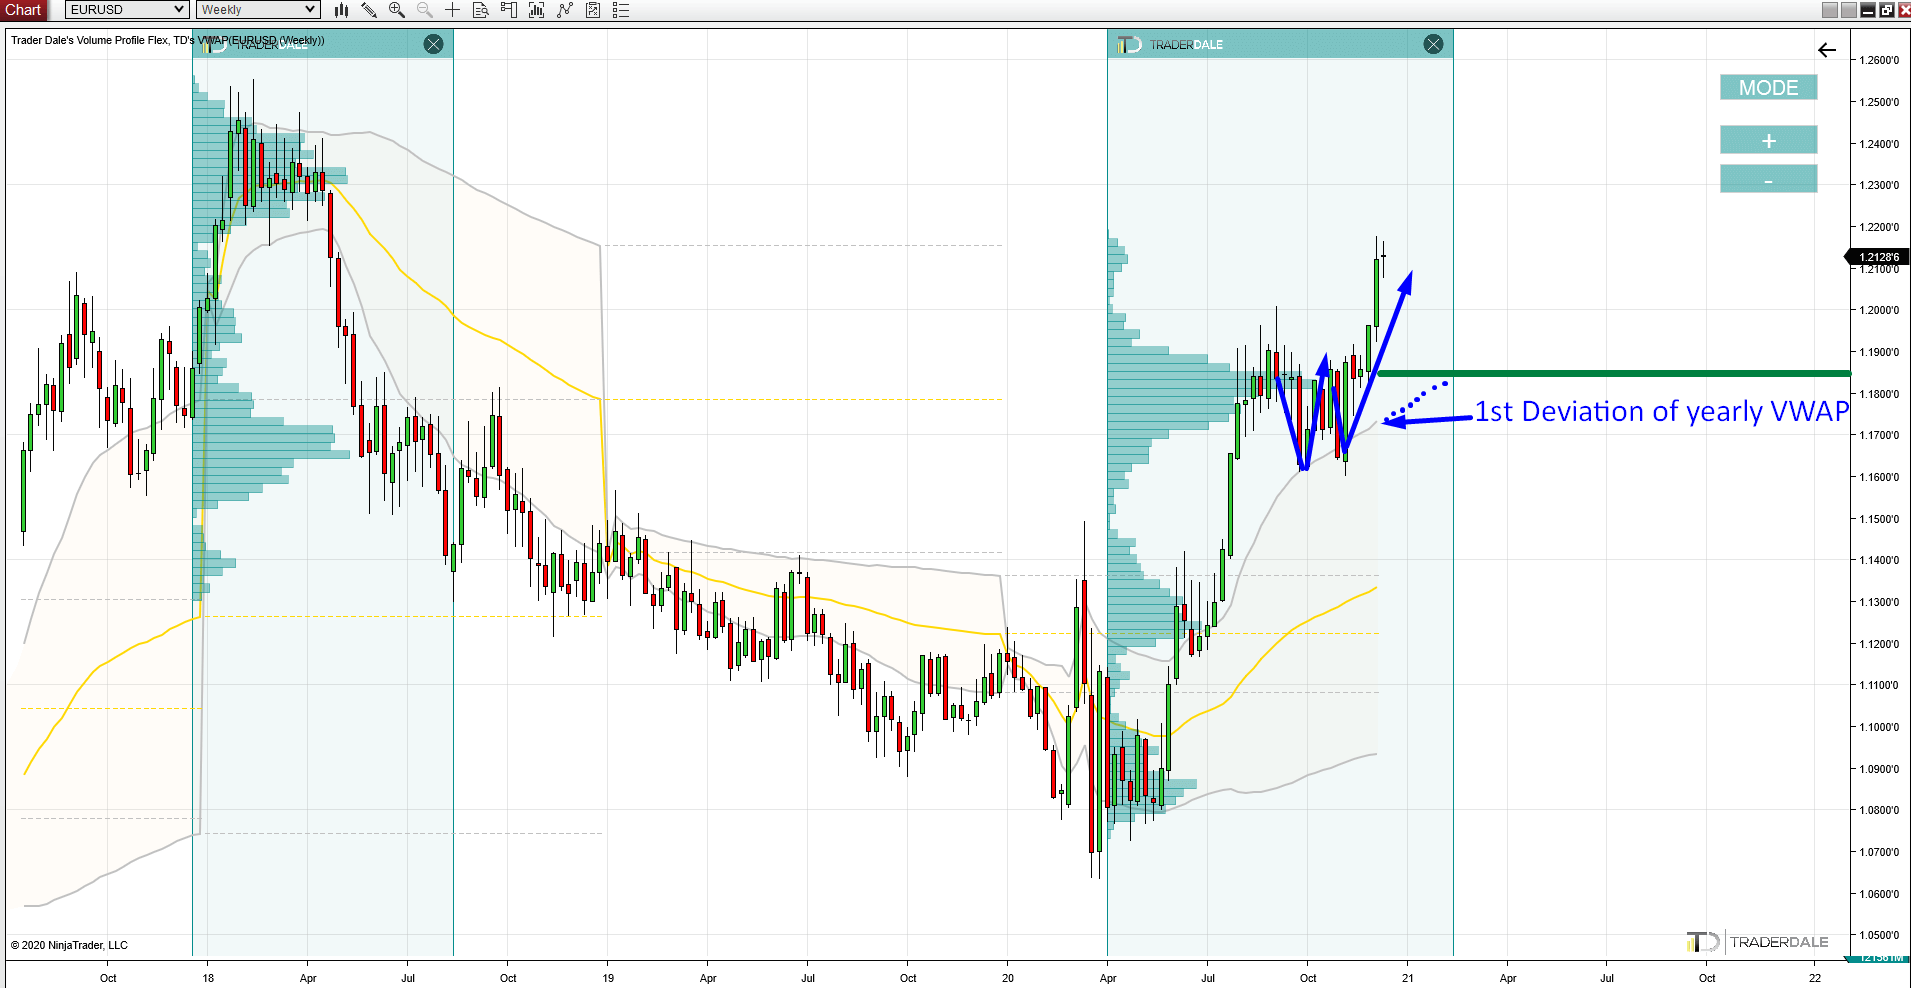
The 1.1850 is a strong support, not only because of the volumes but also because of VWAP!
Do you want ME to help YOU with your trading?
VWAP Analysis
If you look at the picture below, you can see the Yearly VWAP indicator there.
The thing to focus on is definitely the 1st Deviation (the grey line).
When the market is trending, then it tends to react to it. I marked two such reactions with blue arrows. I call this the “VWAP Trend Setup“.
Now, the 1st Deviation is getting very close to the 1.1850 Support. If the price hits this Support and the 1st Deviation is somewhere around, then it will add to the strength of this Support.
I illustrated how it could look like with the blue dots in the picture below.
EUR/USD, Weekly chart, Yearly VWAP:
Mind The Swap
With this kind of long-term trades you should also pay attention to the Swap.
Swap is a fee which you pay (or receive) for every day you hold your trade. Swap can be negative (you pay) or positive (you get paid).
Swap calculation is based on overnight rate difference between the two currencies you are trading. It is also important to know, that every broker has a different swap!
To learn what your swap you will be go to your MT4 platform, go to Market Watch, right click the instrument and go to “Specification”. Then you will see a table like this:

In this particular table you can see, that if you hold Long position, you pay -4.92 pips/day. If you hold Short, then you receive 0.64 pip a day.
If you hold your trade for a day or two, then it does not matter too much, but if it is a couple of weeks or months, then the swap will make a pretty big impact!
BTW. I held a short on EUR/USD for almost 2 years and I made a fortune just on the positive swap (not to mention the +1.600 pip profit)!
If you would like to learn more about this Short trade, you can check out this article, where I predicted this 1.600 pip move:
So, that’s it! Those are the most important zones on the EUR/USD now and how I would go about trading them.
Remember not to get too crazy with your money management and position sizes! Even the best looking trade can fail so be prepared even for this.
I hope you guys liked this analysis, let me know what you think about this in the comments below!
Happy trading!
-Dale

Hi Dale i see that trade is stron and i would like to take it. But im focused on 4hr time frame and im trading swings not that long-term. Is it fine to take this trade even it’s not in my trading style?
Hello, whether you take it or no totally up to you, my friend. If you think it is a good idea and it suits you to trade it, then take the short there. If you dont feel like it and you dont know how to handle such trades, then just skip it. No need to force trades you don’t want to trade. Another option is to take just a small position. Cheers!
Thanks for ur reply. 🙂 i feel convinced with that trade. And the positive swap encouraged me. Thanx alot
Hi Dale, could you show me the Level on 6e future? I use adjusted Chart but the rejection in April 2018 is far away higher at 1.30. I do not understand why?
Hello,
I would not really advise trading this on futures. The price is at a different level there because of the time value of the option which is a part of the futures contract.
This is what I called the trade of the year. It’s unbelievable that am actually witnessing this.
It’s good but please have in mind that even the most perfect examples can fail as all the bad ones. So don’t go all-in on that. 🙂
Thanks, mentor for the heads up. Definitely not going all in.
i closed the trade with 400 pips TP
thanks Dale
perfect! Congratz!
i took the trade midaway at 1.200 and TP 1.850. i have taken a long from 1.847, TP 1.2300, what do u think?
Cool! I would not stretch your TP so much. I would go max to 1.2040 absolute maximum 2060.