Hello guys,
today I would like to show you a nice looking day trading opportunity on EUR/GBP.
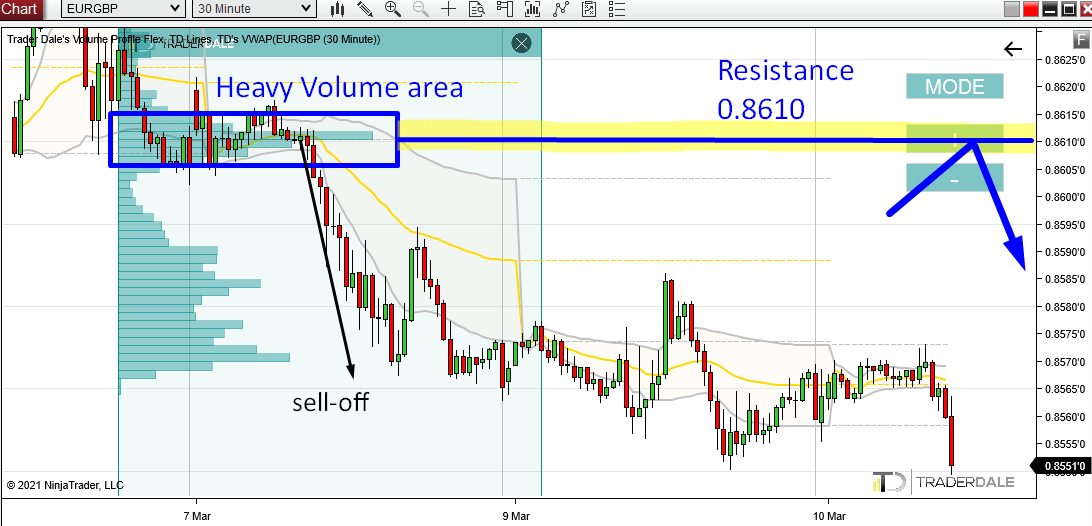
From last Friday to this Monday, there was a price rotation followed by a strong sell-off which took place later on Monday.
This caught my eye because it is what I look for first when I search for places to trade my Volume Accumulation setup.
A rotation followed by a sell-off indicates that BIG trading institutions were building up their Short trading positions in this rotation. Then they pushed the price into a sell-off.
Volume Profile Analysis
The first thing I do when I see such a development is that I use my Flexible Volume Profile in that rotation area to see how volumes were distributed there.
I want to see a heavy volume bump with clear POC. Like here 🙂
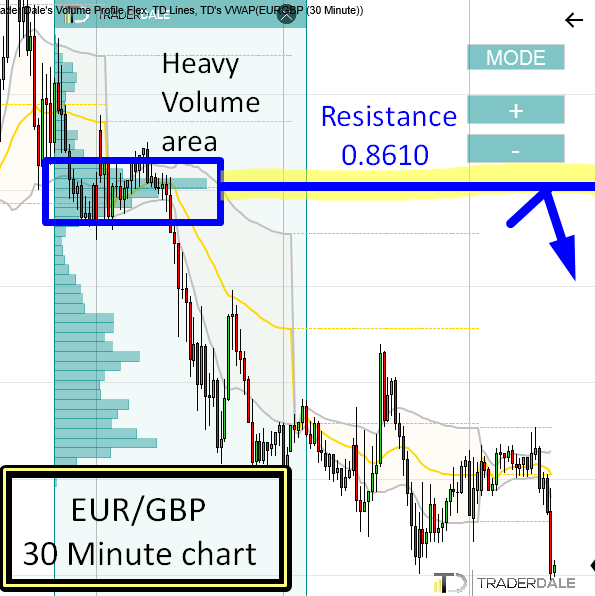
If you look at the picture below, you can see that there were heavy volumes accumulated (traded) around 0.8610. This is where I think most of the sellers placed their Shorts.
From this place, the sell-off started.
When the price makes it back into this area those strong sellers will want to defend it. It is important for them because they placed a lot of their trading positions there.
This is the reason why the zone around 0.8610 should work as a Resistance. When the price makes it to this zone at some point in the future again, I expect a selling reaction. The price should bounce downwards from there.

Do you want ME to help YOU with your trading?
Weekly Volume Profile
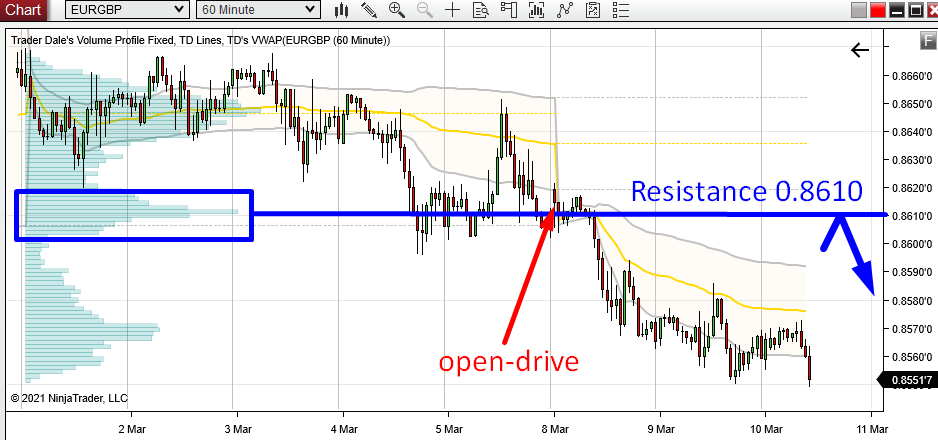
Even though this is an intraday trading opportunity, I always look at the bigger picture – the Weekly Volume Profile.
What I want from my day trading levels is that they are also visible on the Weekly Volume Profile. No need to be Weekly POC, but there should be at least a significant bump.
In this case, out Resistance is very nicely visible there.
In the picture below, I merged two Weekly Volume Profiles (because the rotation was created on Friday and Monday – that’s two weeks…).
Our Resistance stands out really nicely as it represents the 2nd heaviest volume area in those two weeks.
That’s the kind of thing I like to see!

Open Drive
One little addition to notice with this 0.8610 resistance is the Open Drive.
Open Drive means that a day opens and the price goes one way only – right from the start. In this case, it went only down. The highest place the price was on Monday was when the market opened. Then, from this place it went downwards.
You can read more about the Open Drive in my Volume Profile book – free to download here:
I hope you guys liked today’s analysis. Let me know what you think in the comments below.
Happy trading!
-Dale


Hi Dale,
very interesting. I did not believe until now that volume says anything in Forex but your analysis shows me the opposite. So I am interested in this tool and I have bought your books already.
But as I am a little unsecure, if I am able to use this tool sucessfully.
So my question is, if it is possible to get a trial of your volume indicator for some days?
That would be great.
Hello,
yea, volumes work great even from forex which is decentralized.
You can give my indicator a go. Download it from here:
https://www.trader-dale.com/td-software-downloads/
It will work 5 days without any restrictions.
Nice setup Dale, thank you. I will keep an eye on this, think this could be playing next week maybe?
No way to tell when it will play out… Lets just wait and see. Cheers!