

Hello guys,
there were some wild movements on the NZD in the Asian session today. This created some new trading opportunities and in this analysis, I would like to have a look at one of them. This one is on the EUR/NZD.
Volume Profile analysis
Before the strong sell-off in today’s Asian session started, there was a price channel formed. It was forming more than one whole day. I used my Flexible Volume Profile to look into this area and I discovered that there were pretty massive volumes traded within this channel.
The heaviest volumes were traded at 1.7088. This is the Point Of Control of this rotation area.
From there, the price went into the sell-off.
What does this tell us? This tells us, that there were strong sellers building up their short positions within that rotation area. After they have entered their positions, they pushed the price aggressively downwards.
Big trading institutions need time to enter their positions. That’s why they do it in a rotation, which allows them to do it slowly and without being noticed.
EUR/NZD, 30 Minute chart:
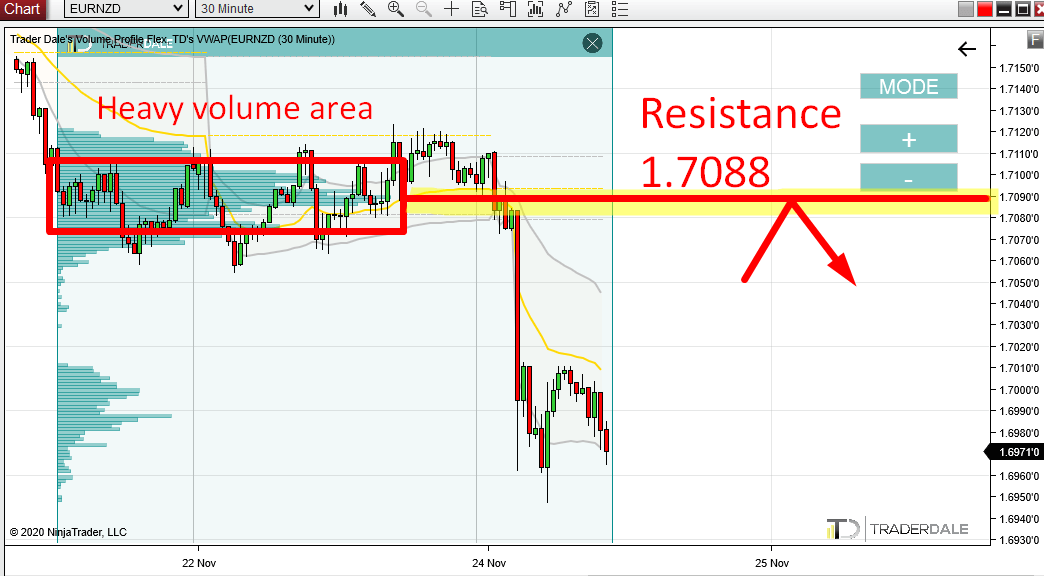
How do we work with this information now? We know there were strong sellers around 1.7088, right? Now, when the price makes it back into this area again, we can expect that those sellers will become active again. If they do, they will start to push the price downwards from this area again.
This is what would make the 1.7088 area a resistance.
What I just showed you is actually my favorite Volume Profile setup. I call it the “Volume Accumulation Setup“.
Do you want ME to help YOU with your trading?
Price Action setup: Support →Resistance
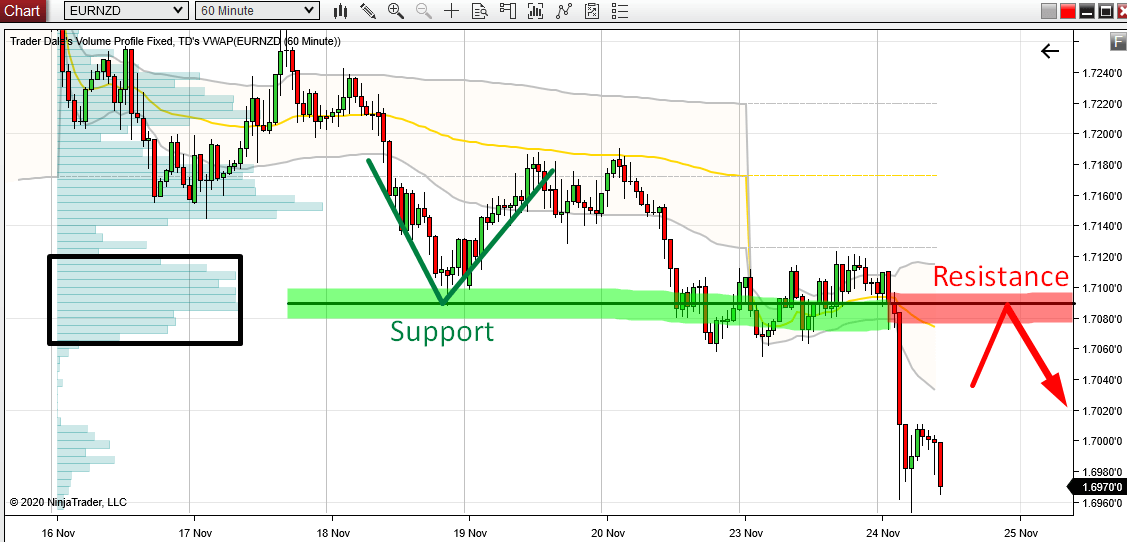
There is also another thing that supports the idea of the new Resistance around 1.7088.
If you look at the chart below, you can see that the price has already reacted to this area in the past. It made a strong reaction there and bounced upwards. This indicates that it worked as a Support.
Now, when the Support got breached it became a new Resistance. The cool thing about this is that this is exactly at our volume-based level at 1.7088!
I consider this a very nice confluence of two trading setups – the Volume Accumulation Setup, and the Support →Resistance setup.
EUR/NZD, 60 minute chart:
EUR/GBP resistance from yesterday
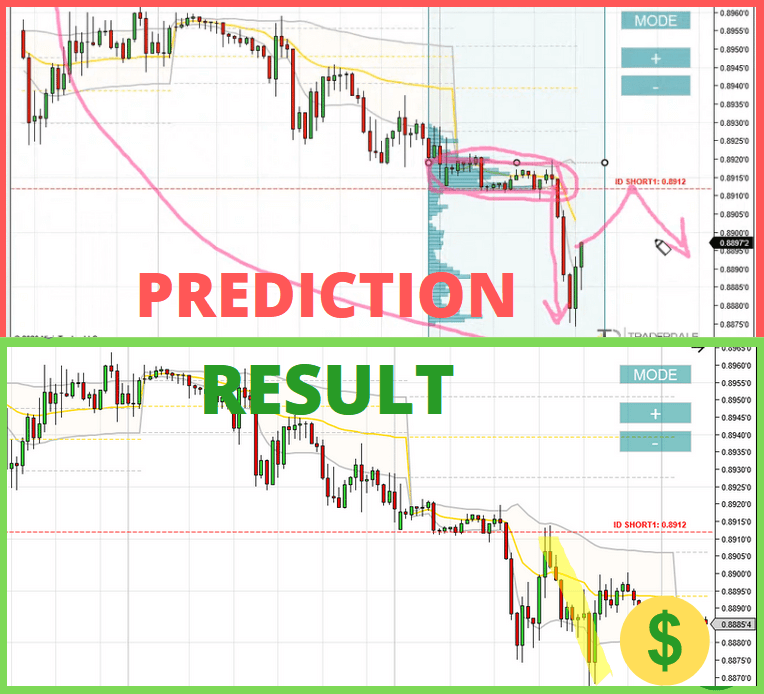
There is one more thing I wanted to show you before I wrap this up. It is a nice reaction to the Resistance which I showed you yesterday on the EUR/GBP. This one was also based on the Volume Accumulation Setup.
Here is the prediction and the result.
EUR/GBP, 0.8912 Resistance, 30 Minute chart:
If you missed the prediction which I sent out yesterday, then you can check the whole video here: Forex Trading With Volume Profile – Weekly Trading Ideas 23rd November 2020
I hope you guys liked this analysis. Let me know what you think in the comments below!
Happy trading!
-Dale

Nice analysis mentor. But during yesterday analysis you said taking short on eurgbp would be too risky if there is a quick retracement (if the market didn’t accept lower prices). Its clear the price did retraced quickly. Wouldn’t be too risky to have taken the trade?
Hello Tim, thats a good question. It would be risky if the price retraced back sooner – as I was doing the video for example. The price was almost 3 hours below the level by the time it got hit. Thats quite okay to take.
Okay. Thanks for the reply!
My pleasure as always Tim.
EUR/NZD level is spot on. Simply amazing…..
That’s how the Volume Profile works. 🙂 Thank you!