There are just a few basic shapes the Volume Profile can print. It is the D-shape, P-shape, b-shape and the Thin profile shape.
More on the other shapes here:
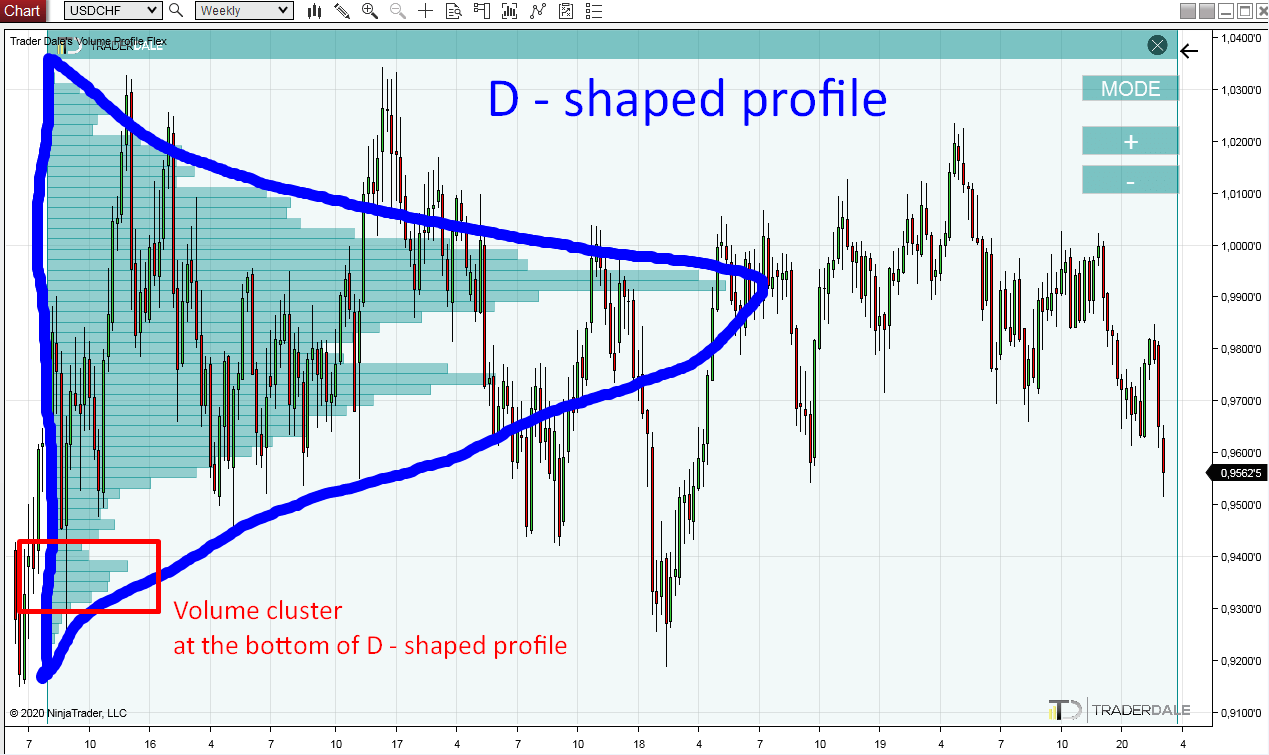
D-shaped profile
The most common shape is the D-shape. It is called the D-shaped profile because the volume histogram shape corresponds with the capital letter D. The reason this profile shape is the most common is that it forms when there is a rotation. If you look at any time frame on any trading instrument you will see that around 70-80% of all the time markets spend in a rotation! That’s why the D-shaped profile is so common.
How to trade the D-shaped profile?
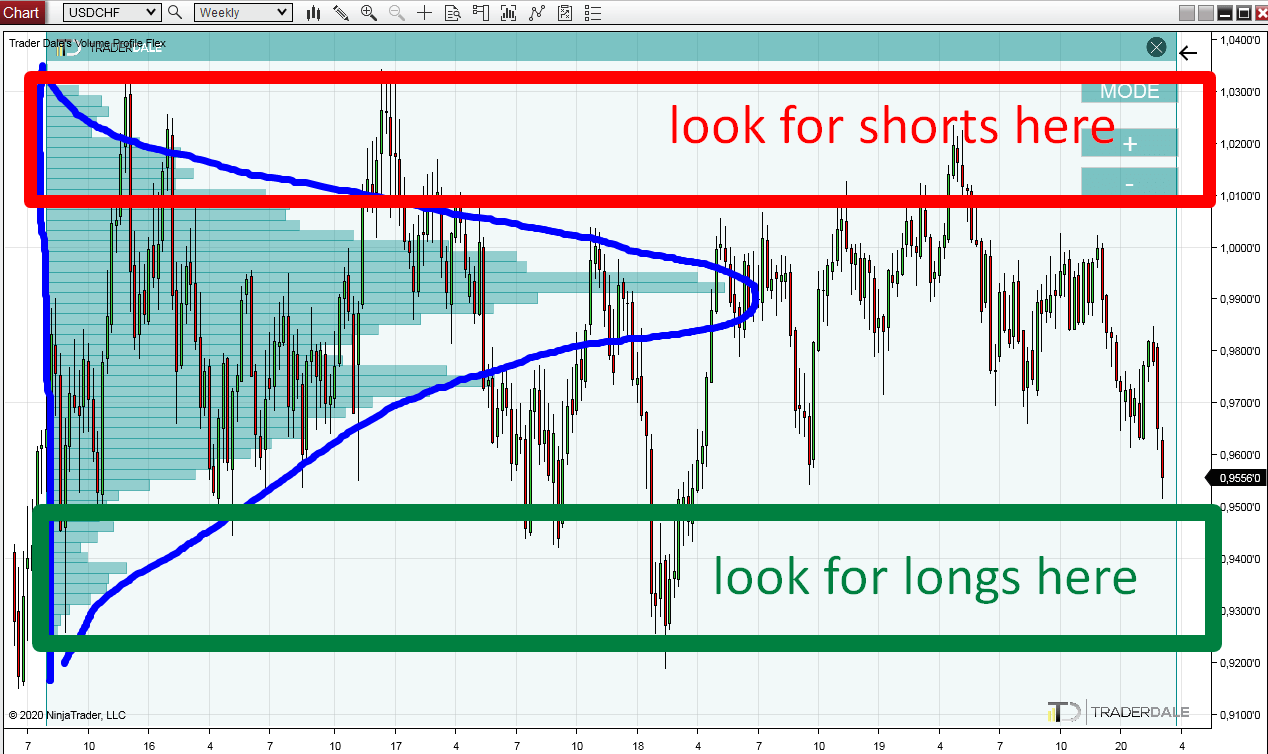
The way I prefer to trade this one is to look for shorts at the highest extremes of the D-shaped area and look for longs at the lowest extremes of the D-shaped area. When there is a D-shaped profile then I don’t trade the Trend Setup (because there is a rotation).
Below, you can see a Weekly chart of USD/CHF. There is a long-term rotation (over 5 years long) and the Volume Profile shows a nice D-shape. I marked the zone where to look for short trades and also the zone for longs. The Short zone is at the top of the D-shape, The Long zone is at the bottom.
Do you want ME to help YOU with your trading?
What exactly to look for?
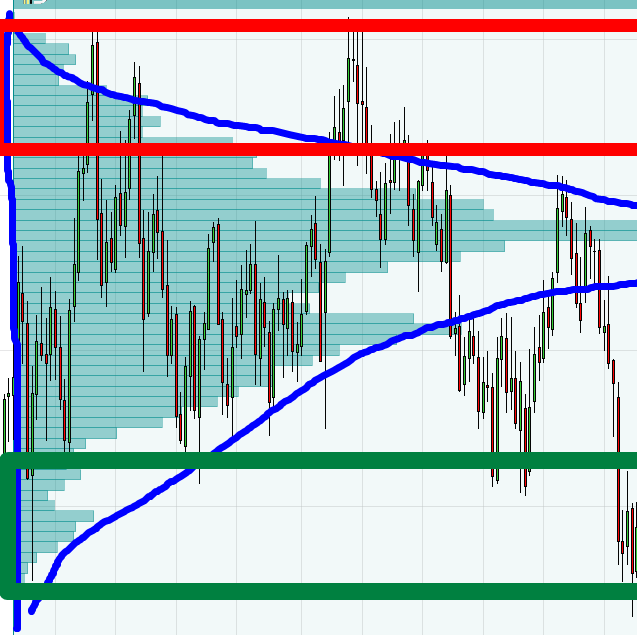
What you want to look for are significant Volume Clusters which got created in the short or long zones (extremes of the D shape).
In this case, there is a nicely visible Volume Cluster created at the bottom of the D-shape (in the Long zone). This could work as a strong support!
Where EXACTLY did this Volume Cluster got formed? If you look at the chart it is pretty obvious, that it was in the strong rejection of lower prices from January 2018.
What you can do to make sure (and also to pinpoint the exact location) is that you can use the Flexible Volume Profile to look into this rejection and see how the volumes were distributed there.
I did just that in the picture below. There were pretty nice and heavy volumes created at the bottom of the rejection!
What this means is this: Sellers were pushing the price aggressively downwards. Then strong buyers came. There was some time of volume accumulation (buyers entering longs) and then the buyers became aggressive and they pushed the price swiftly upwards.
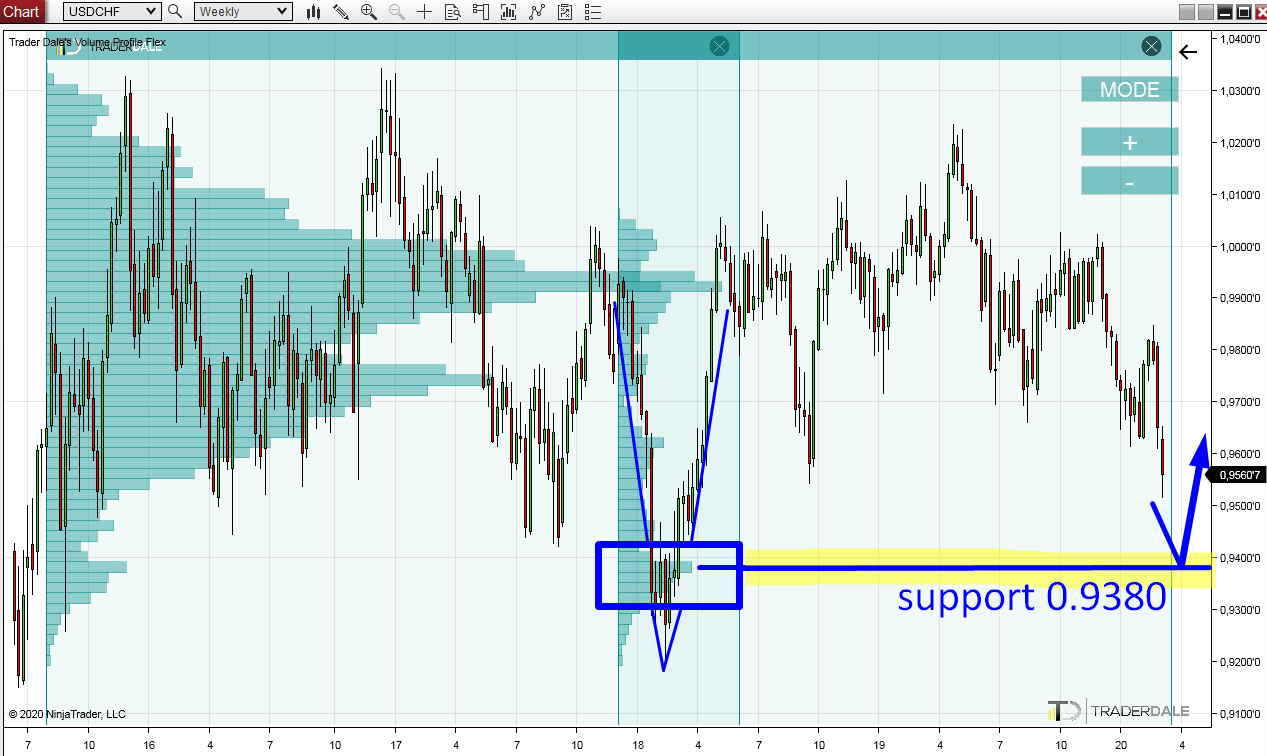
The Volume Cluster I marked in the picture points us to a place where the buyers entered most of their positions.
When the price makes it back to this level again sometime in the future, then it is pretty likely that the buyers will become active again and they will push the price upwards (again).
This is why I think this area will work as a strong support.
Recommended Forex Broker
I hope you guys liked this article. Let me know what you think in the comments!
Happy trading!
-Dale
Honestly you are a genius
I joined you in the course and I do not regret
thank you indeed
ANAS-MOOK
Honestly, you are a genius. I joined you in the course and I do not regret it. Thank you very much,
ANAS-MOOK