
In this trading analysis, I am going to focus on long-term position trading on the EUR/USD.
The great advantage of long-term position trading is that you don’t have to sit in front of the screen all day and you can still have really good trading results.
In fact, many people have way better results with this kind of trading approach than for example with intraday trading.
In my opinion, the reason is that price reacts better to strong long-term supports and resistances than to weaker intraday trading levels.
The reason is that there could easily be a change of sentiment/mood during intraday trading session. On the other hand, with long-term investing you don’t need to care about this too much. You also don’t need to care about any macro news and news releases. They don’t really play any important role in this big scope.
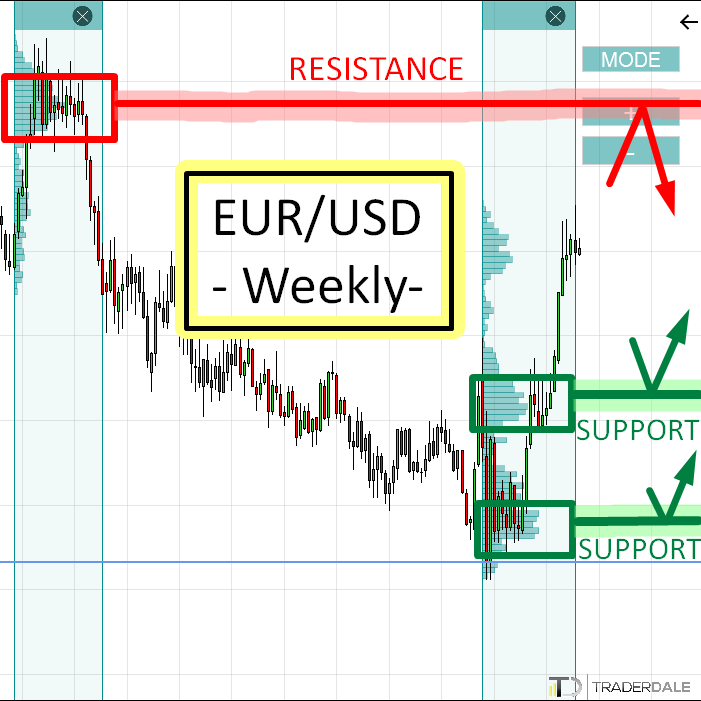
In this analysis, I am going to focus only on the EUR/USD on a Weekly time frame and I am going to point out the most important institutional S/R areas.
Resistance at 1.2300
In 2018 the price of EUR/USD dramatically changed. First there was a really strong uptrend but then it turned and a strong sell-off started.
BTW. I predicted this trend change couple of years back. You can check the prediction and the reasoning behind it here:
EUR/USD: Reversal prediction from 2018
Anyways, in the area of the strong rejection, there were massive volumes accumulated. After this volume accumulation ended, there was a strong sell-off.
Because of this sell-off, I believe that those volumes at the top of the rejection were volumes of big institutional players (banks, hedge funds, pension funds, …).
Those big guys always need a lot of time to accumulate their huge trading positions. When they are done with the accumulation, they usually start a really strong trend. Like in this case.
Now, when the price makes it back into this area again, I believe that those institutions will still want to trade in this area – to defend it. So, when the price gets there again I believe they will start an aggressive selling activity with the intention of driving the price downwards again.
That’s why I think this area around 1.2300 (that’s the Point Of Control of this area) will work as a really strong long-term resistance.

This level is over 2 years old! Will it work???
I know you are going to say that you doubt this level will work, because it is over 2 years old and that those institutions won’t be there anymore. Every time I post such a long-term analysis I get such messages 🙂
What I have learned in my 12+ years trading career is that markets have excellent memory. No mater how old the level is, the markets know about it and it is very likely they will react to it.
A discussion like this was there below a long-term EUR/USD prediction I made in 2018. Guess what? I made a +1.600 pip trade on 3 years old volume-based resistance (published on this website – from start to end)!
One more proof of how good the market memory is!
Do you want ME to help YOU with your trading?
Supports on EUR/USD
Currently, the EUR/USD is in a strong long-term uptrend. That’s why I started to look for some supports to trade longs from.
What I always do is this: I use my Flexible Volume Profile indicator and I use it to look into the trend and also into the rotation that took place before the trend started.
In this case, my Volume Profile showed two very significant places there. Those places were areas, where heavy volumes got accumulated.
Support at 1.1300
The first significant area is a strong volume cluster created around 1.1300. The volumes we see there are in my opinion volumes of strong buyers who were adding massively to their longs there. From this place, they pushed the price even higher.
What will happen when there is a pullback and the price makes it back to this 1.1300 area again? I think that those buyers will want to defend their long positions. They will want to push the price upwards again.
So, they will start an aggressive buying activity (using Market orders). With this buying activity they will hope to start a snowball effect – more buyers would join in. This would drive the price upwards again.
That’s why I think the area around 1.1300 will work as a strong support.
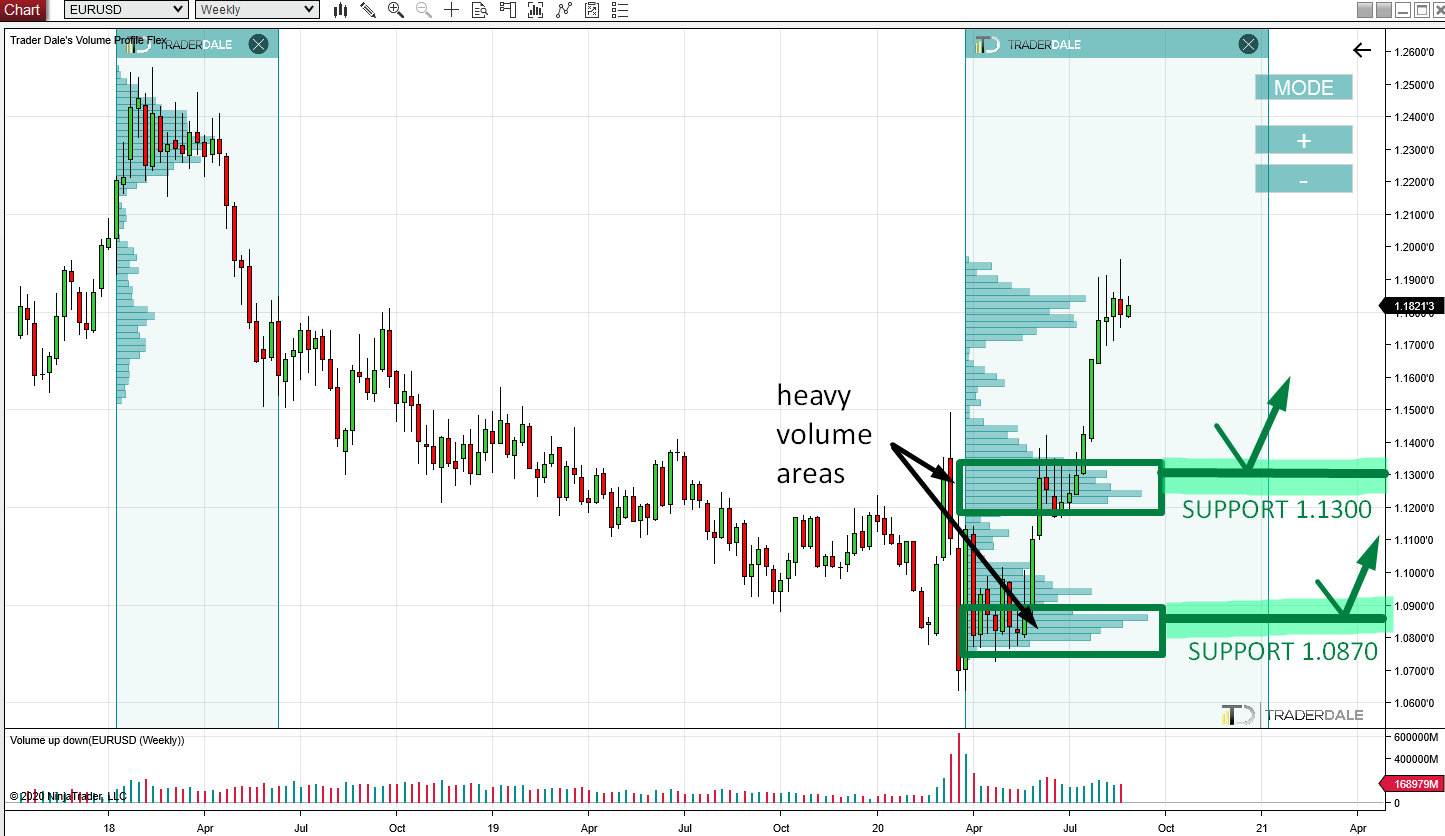
Support at 1.0870
Another significant support from the long-term point of view is around 1.0870.
This one is based on a setup which I call the Volume Accumulation Setup.
In this case, there were heavy volumes accumulated at the base of the current uptrend.
My Volume Profile shows there was some serious trading activity taking place around the 1.0870 area. And what activity that might have been?
Well, since the price shot from this area in a crazy strong uptrend I assume that those were strong institutional buyers entering their longs there.
It took them some time to accumulate their massive trading positions, but after they had done so, they started aggressive buying to start the uptrend we see now.
What is most likely happen when the price makes it back into this area at some point in the future (could be in months, or years even…)?
I bet there will be another buying activity and another strong reaction from the big institutional buyers. This activity would push the price upwards again.
That’s why I think the area around 1.0870 will work as a strong support.

BONUS – Reaction to 3 years old volumes
Before I wrap this article up, I wanted to show you one more example of price reacting to super old volume area.
This heavy volume area got formed at the break of 2016/2017 and it was at the base of a really strong uptrend.
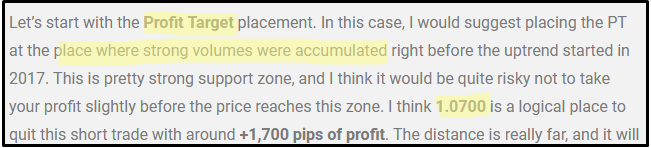
In an article from 2018, I predicted that the EUR/USD would go down and I said that the ideal Take Profit for a short position would be at 1.0700.
Why 1.0700? Because I thought that the heavy volume cluster from 2016/2017 would work as a support. Therefore, it was best to quit the short before the price reached this support.
Here is how it went (EUR/USD, Weekly time frame):
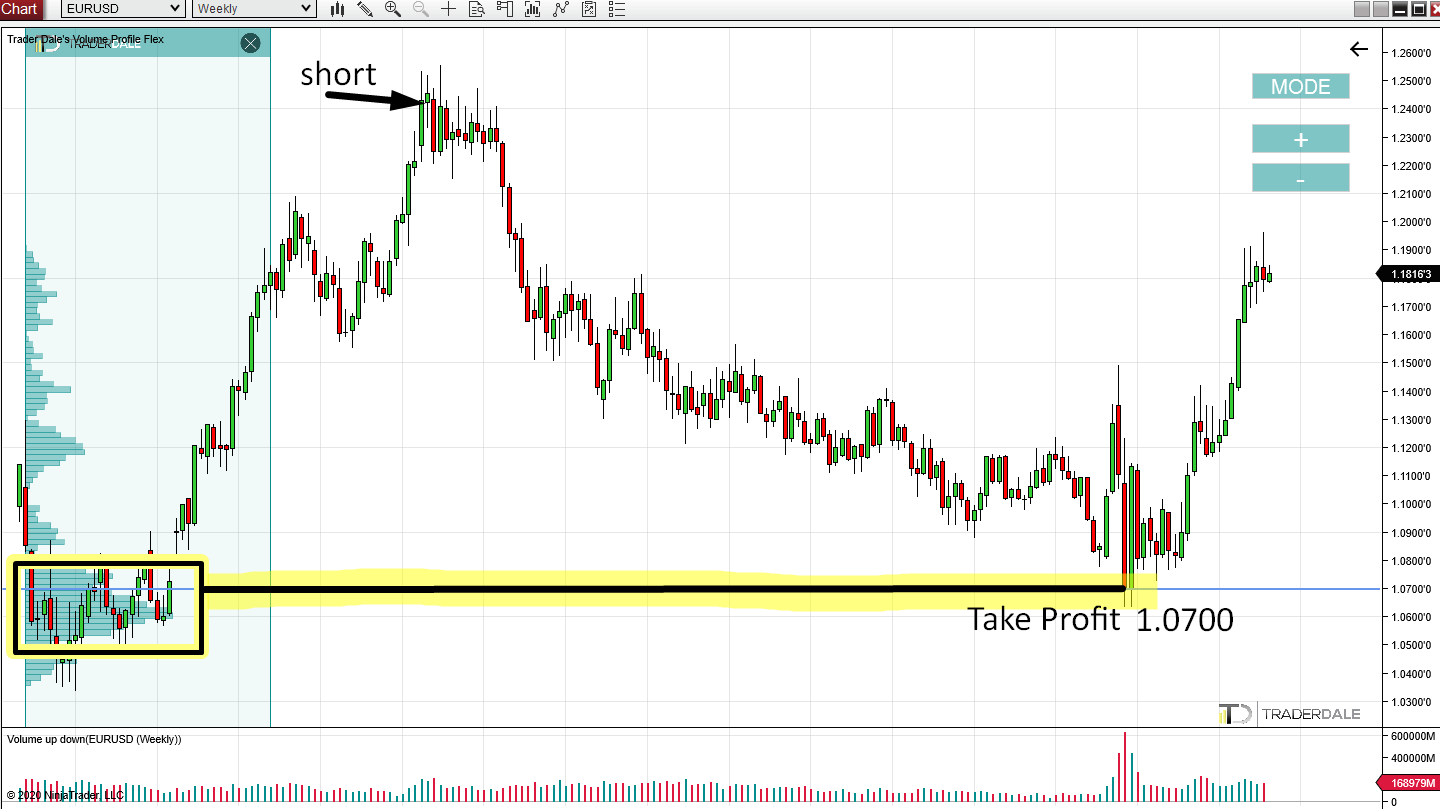
As you can see this heavy volume area really worked as a support and the 1.0700 was the best place to quit the trade.
Below is the original picture I used back then along with the original commentary on Take Profit.

If you would like to learn more about this particular trade you can do so here:
I hope you guys liked this long-term analysis. Let me know what you think in the comments below!
Happy trading!
-Dale
PS. I publish my Swing trading levels in the Members area of my Trading Course. You are welcome to join us here:
Hey Traderdale
Does this ean that you are long euro dollar to target 1.23?
I know anything can happen,news election and so on.
If you are a swingtrader you are doing very god with this setup.
Best regard
Davy
Hello Davy,
no I am not long EUR/USD. The level is a resistance. I am not saying the price will reach it now. It can take some time. But when the price reaches it, then I will expect a selling reaction there.