One of the best things about Volume Profile is its versatility. You can use it across timeframes, and of course on all possible trading instruments. In this article, I’m going to walk through how to use the Volume Profile to find and plan trades that are basically long-term investments rather than the usual intraday or swing trades. To give you some idea what I have in mind – stop losses for such trades are in hundreds of pips, with a take profit stretching over 1,000! These very long-term setups many take months or years develop and trigger. Following your entry, you can be in the trade for another few months. Crazy, right? Well, it sounds crazy only if you look at it from the point of view of an intraday or swing trader. Imagine yourself being, for example, a stock investor. This kind of trading is much closer to that style than it is our typical day trade or swing trading setups.
The great thing about those trades is that you can plan them way ahead and then just set a limit order and all but forget about it. After you do your analysis and set your limit order, you don’t need to spend time thinking or managing this trade another minute. This type of trade is ideal for people who like investing but don’t really want to sit in front of the computer analyzing charts every day.
Let me now show you how to plan this type of trade. I will demonstrate on a current investment opportunity I see on the EUR/USD.
EUR/USD Long Term Position Trading
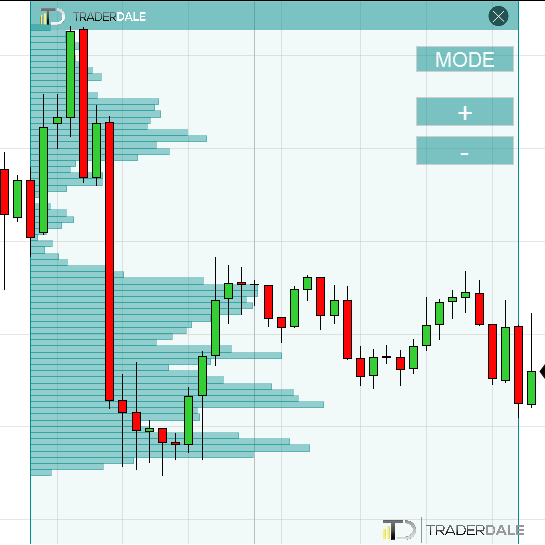
I made this analysis with a Monthly chart (1 candle = 1 month). This chart shows you the past 14 years.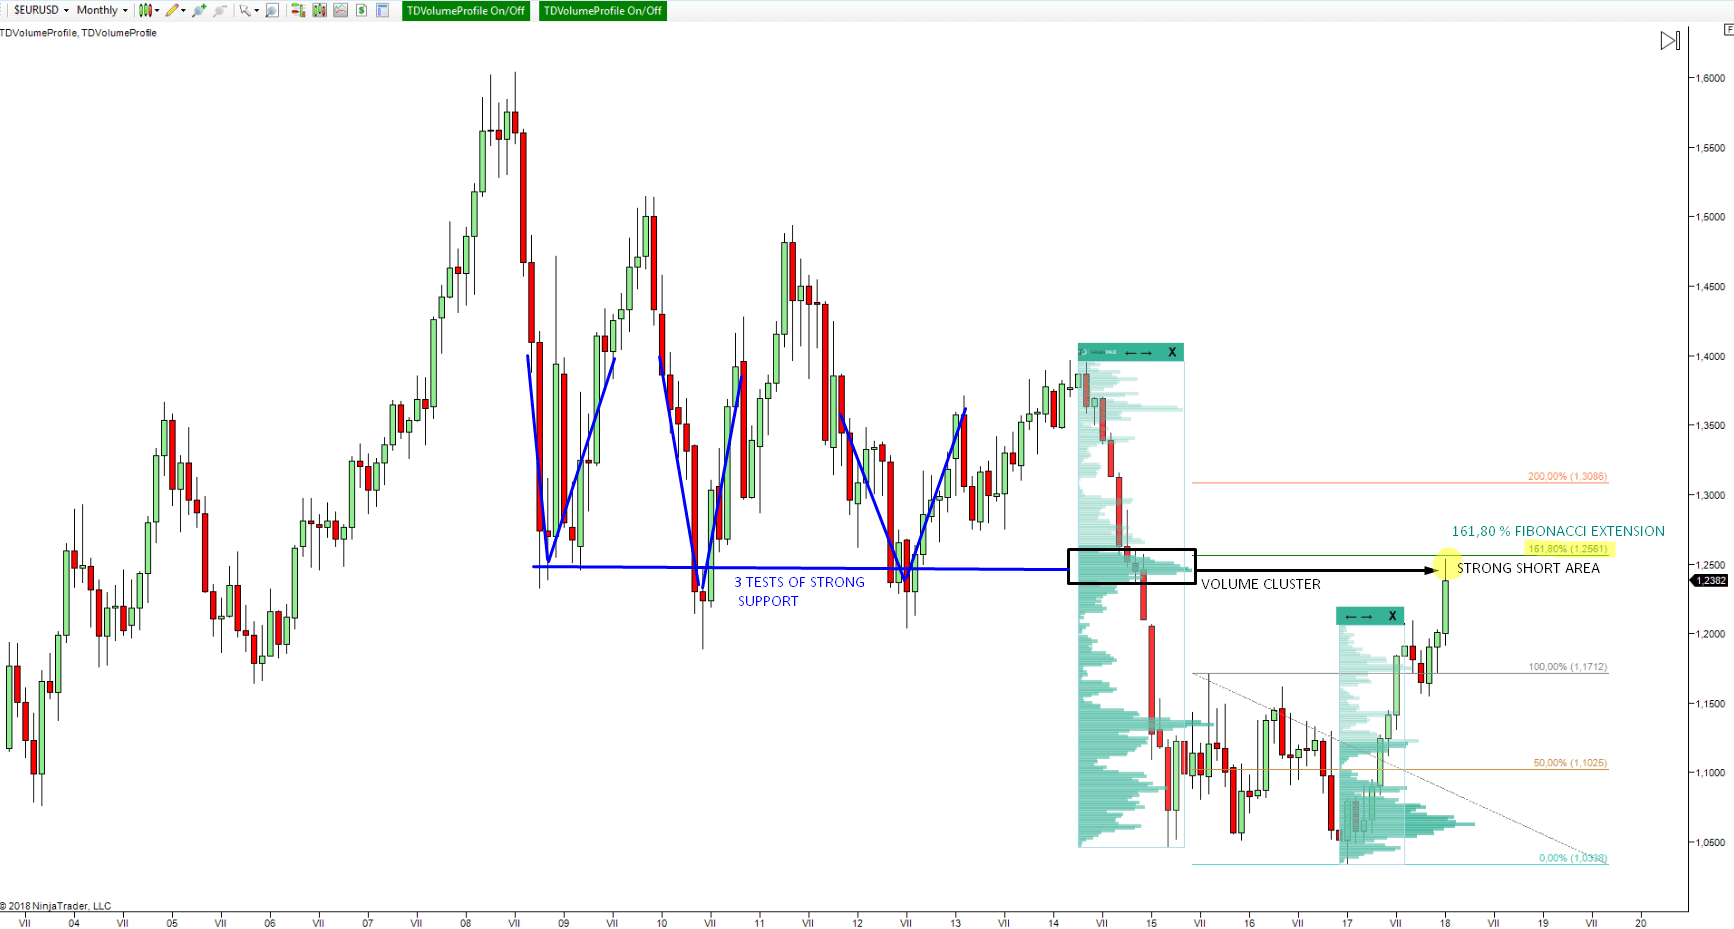
The first thing that caught my eye was the price bouncing off one support zone three times. I marked those three strong reactions in blue color. Those three strong reactions were back in the years 2008, 2010, and 2012. Because of those extremely strong reactions to this area I consider it a strong support zone. As you can see the price finally went past this strong support at the end of 2014. When such a strong support gets breached, it becomes a strong resistance zone. Even though the price hasn’t returned to this area since the end of 2014, it remains a really strong resistance zone. This support becoming resistance is the first step and the first confirmation of this type of trade setup.
The second confirmation of this level is a significant volume cluster that got created within a strong trend. I call this a Strong Initiation Setup. I usually trade this setup as an intraday or swing trading setup, but it works very nicely for an investment trade setup like this one. The idea behind the Initiation Setup is that the strong sellers that were pushing the price lower, were adding to their short positions at the volume cluster and then continuing the aggressive selling activity. When the price returns to this volume cluster, those sellers will likely be defending their positions, and they will start the aggressive selling activity again. This should push the price lower again.
The two reasons above would be enough for me to consider this a good level to trade from. Additionally, I spotted one more confirmation of this strong resistance zone, which is the 161.8% Fibonacci extension. To make myself clear – I personally don’t give Fibs much value in my analysis or decision making (as they are somewhat discretionary) but having another confirmation is a good thing. Still, I would never base a trade solely on a Fibonacci extension level. In this case, I used the high and the low of the significant sideways price action channel formed between 2015 and 2017. We can consider this channel as a sort of temporary equilibrium place which the market saw as fair value for the EUR/USD over the last 2+ years. The high and low in this area is quite strong orientation point. When I used the Fibonacci extension in this area I noticed that a very significant extension of 161.8 % is basically in the resistance zone I identified earlier (exactly at 1.2561). Bingo!
How To Enter The Market
So, those are three pretty solid confirmations of our resistance zone. Let’s now have a look at how to trade it.
Let’s start with the Profit Target placement. In this case, I would suggest placing the PT at the place where strong volumes were accumulated right before the uptrend started in 2017. This is pretty strong support zone, and I think it would be quite risky not to take your profit slightly before the price reaches this zone. I think 1.0700 is a logical place to quit this short trade with around +1,700 pips of profit. The distance is really far, and it will most likely take many months for the price to get there. If you personally prefer a tighter take profit, you can look to take profit (or part of it) at 1.1700 which is also a very strong support zone (reason being is the volume cluster along with the 100 % Fibonacci).
A good place for a Stop Loss is around (or just a little bit above ) the 200 % Fibonacci extension at 1.3086. Apart from the Fibonacci, you can see that the high volume area basically ends there. If the price goes past the heavy volume zone, it won’t work as resistance any longer. As such, should that level break it is best to have your stop loss in that area.
Second Trade Setup Scenario
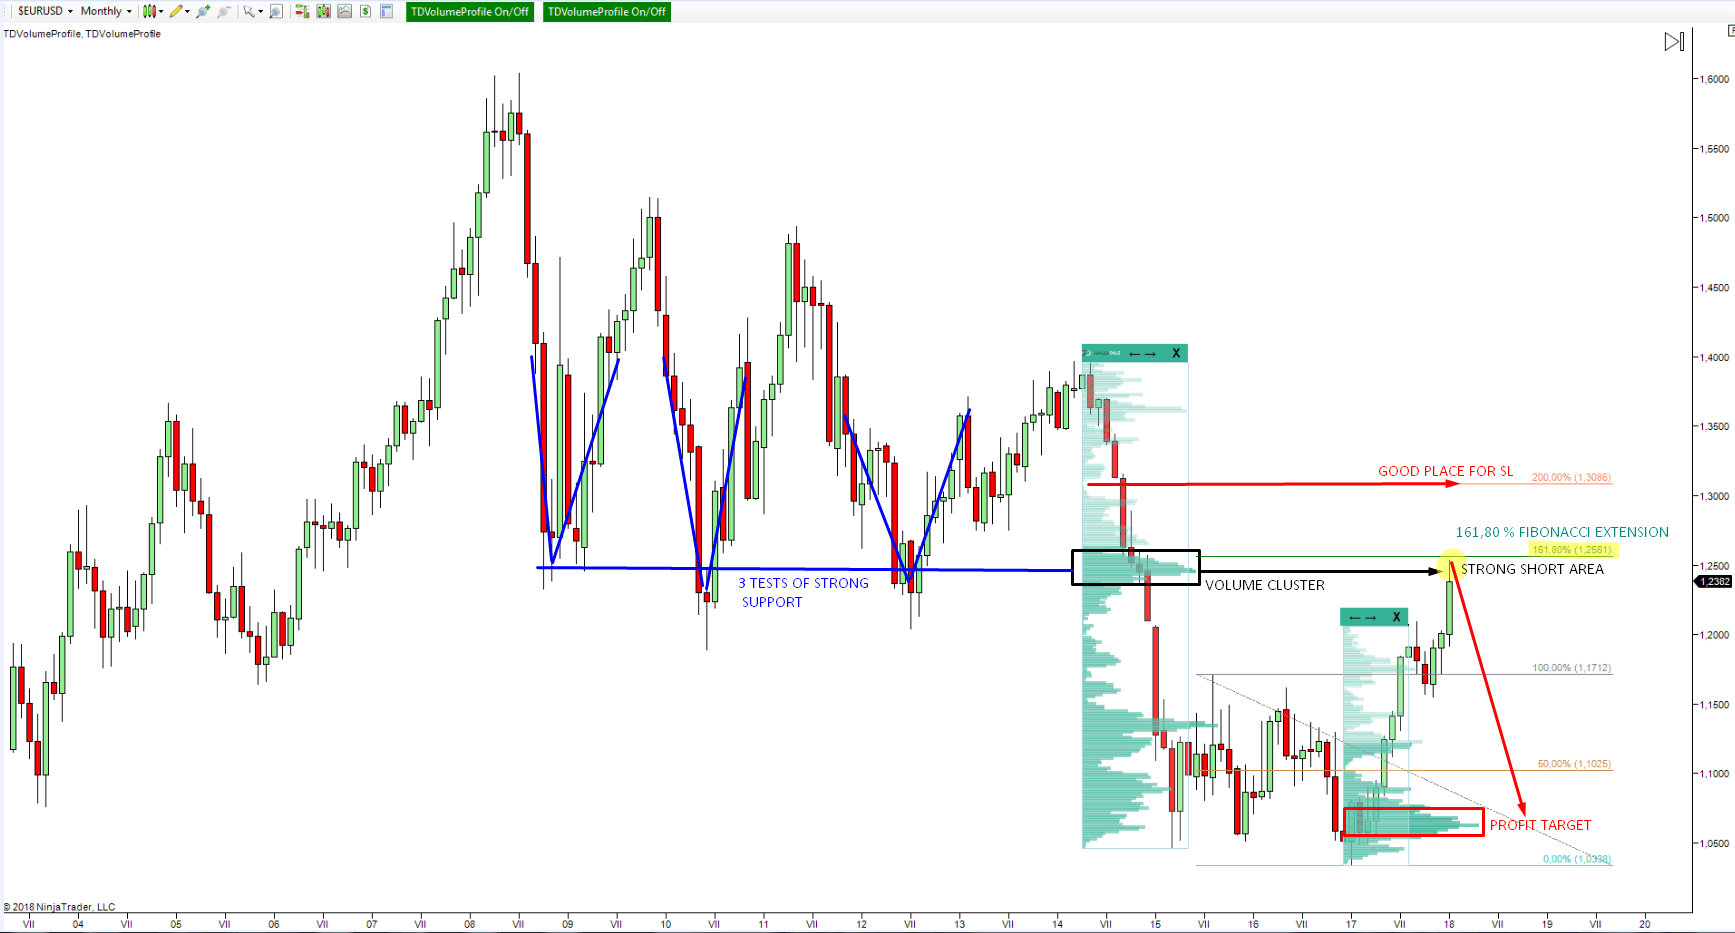
If my first scenario doesn’t work and the trade ends in a Stop Loss, the game won’t be over yet. At least not for me. Here is what I will do:
If I take a Stop-Loss, then I will wait for the price to get back to the place where I originally went short and I will go long. Reason? Support becomes resistance (and vice versa), remember? 🙂 Such a strong level is usually not left without a significant reaction and for that reason, if my first attempt fails, I won’t be discouraged but I will wait and enter a reversal position.
The Profit target for the reversal position will most likely be around 1.3600 because it is a strong volume area. It is basically the Volume Accumulation setup there (= strong resistance). The Stop Loss could be little below the 100 % Fibonacci and below the heavy volumes. This is around 1.1600. Those volumes and the 100 % Fibonacci would be the last barrier which would be likely to stop price. If that fails there would be no reason to remain in the long position anymore.
So this is my investment idea for the EUR/USD. As you can see it isn’t really that complicated. Especially if you do this kind of analysis from time to time you will get better, faster, and more confident in doing it. Planning such a trade could realistically take you 10-20 minutes. After that, you can just set a limit order and check your trade once a week or even less!
Money Management & Risk Per Trade
I would like to stress one very important thing. You need to calculate the volume of your trading position before you enter the market. Having, for example, a 500 or a 1,000 pip SL requires you to adjust your position so you don’t risk more than your money management plan will allow. I would keep your risk per trade between 2 % and 5 % of your total account balance. With that being said, this is only a guideline and you must adjust your risk per trade based on your own risk tolerance.
Happy trading
-Dale
Very nice commentary and analyses. Thanks for this. 🙂
Thanks great analysis
Do you realistically believe that people who short at that level in 2014 are still waiting around for the price to come back and short again? I don’t think so. But, amongst the randomness of the financial markets, anything can happen. If you get this trade right, please send me a picture and I’ll put you just beside my trading display!
I really believe what I wrote and I am already in the position. I am looking forward to sending you the picture 🙂
+500 pips open profit from this position. Is it time for me to send you my picture? 🙂 🙂
+688 pips profit now. Should I send you the picture now? 🙂
LOL! That is too funny!
Where is Medasculo now? LOL! 🙂
Trader Dale, I am not your subscriber yet, but getting close when you have a good offer on the table. I am watching your site constantly
Hi Terry,
There is an independence day sale at the moment with my tools discounted at 50%, I surely wouldn’t go lower than that. I hope you understand.
Pure technical analysis. I agree there should be fireworks off the 1.2500 level. Personally I expect a sell of the double top at 1.2455 to the 1.2175 area then a further rise to the 1.2500 level to play out over the next 6 months.
The technical analysis should be overlaid with fundamentals. The ECB is due to reduce / end QE in September and a possible / probable increase interest rates, which will strengthen the EUR in late 2018.
The current USD weakness at 109.23 JPY, which is a major support / psychological level around 109.00. With up to 4 interest rate increases forecast by the Fed, we should see USD strengthen during the first half of 2018 (confirming my sell option on EUR/USD off the 1.2455 level as stated above as the USD rises to around the next support / psychological level of 113 / 114 JPY.
In summary a sell for EUR/USD off current levels, before surging above 1.2500 in late 2018 as ECB tightens monetary policy.
All good stuff Dale, some good comments as well. I particularly like John’s comment regarding overlaying fundamental analysis onto the strong technical analysis.
Nice.
Thanks for your comments guys, appreciate it! I like your opinions and the fundamentals you brought into the discussion.
I have just closed part of the position with +688 pips profit.
Good Job Dale. Yeah, you called that one – price went to the 1.25 area (point of High Volume from Months ago), then retraced back down!! Very cool!
Guys, +1.094 pips now in open profit. Anybody in the EUR short with me? 🙂
Trade closed NOW. The result is a profit of +1600 pips, plus positive swap every day for 1.5 year 🙂
What a great trade.! 1600 pips. In 1 trade? Perfect.
I remember when u said thats the opportunity of the decade.
Thank you!
I’m interested in that kind of long-term opportunities. Kindly notify me by Email if there is opportunity like that in the future . (I’m a member)
Thanks Dale.
I come here from https://www.trader-dale.com/eur-usd-long-term-position-trading-analysis-with-volume-profile/ and it’s totally amazing result. So, you must take 1700 pips profit from this trade, right. Incredible. I’m just a beginner and you are the very first professional trader that I follow, try to learn from, and be impressed by what you’ve done.
Thank you so much! Someday I will think about charging for your Volume Profile tool. Now I’m totally broke. I lost $8000 for a scam in 2019 and I’m still working hard to deal with debts and to re-start my investment, trading which I love the most.
Wow! I’m blown away. Writing in 2020, this looks more like a bad news to me. I wish I was there when this prediction was being made. I hope this kinda opportunity will come one of this days. Thanks Dale for the historic analysis!