

Hello guys,
today I will comment on a really fresh resistance that has just formed.
This resistance is an intraday trading resistance on EUR/AUD and you can best see it on a 30 Minute and 60 Minute time frame.
Let’s start from the beginning – I will go through the process of my thoughts which I had when I opened the EUR/AUD chart today.
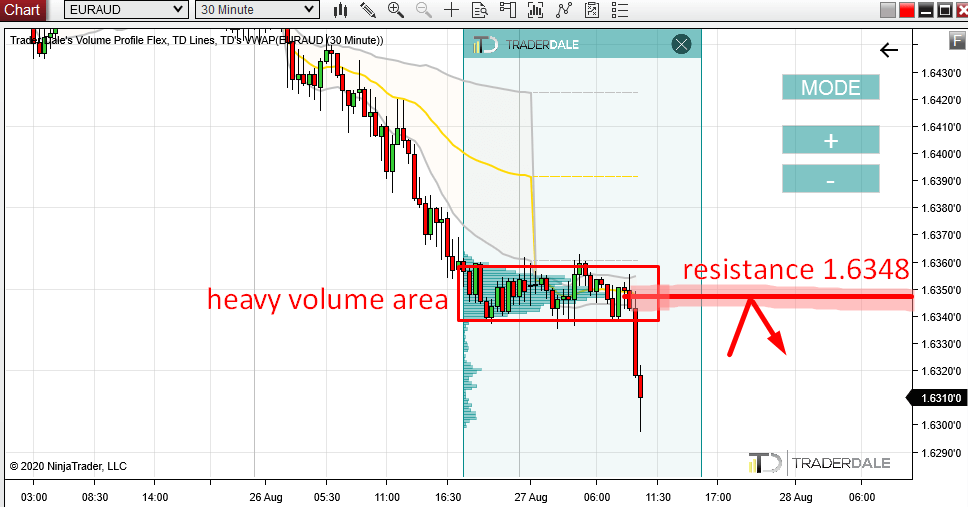
The first thing that immediately caught my attention was the nice rotation that started before yesterday’s market close and ended in today’s EU session (I marked this rotation in the red rectangle).
This rotation was followed by a strong selling activity. In fact, the selling activity is taking place right now, as I am writing this. It is still very fresh.
Volume Accumulation Setup
A rotation like this followed by a sell-off is my favorite trading setup called the Volume Accumulation Setup.
The logic behind this is that sellers were accumulating their short positions in the rotation.
When they have accumulated them, they have started a strong selling activity with the intention of driving the price into a downtrend.
In that trend, they would make money on their shorts.
When the price makes it back into the area where they placed most of their short positions (around 1.6348), they will try and defend those positions.
Those sellers defending their shorts should push the price downwards from the 1.6348 again.
That’s why I think the area around 1.6348 is a strong intraday resistance.
EUR/AUD; 30 Minute chart:

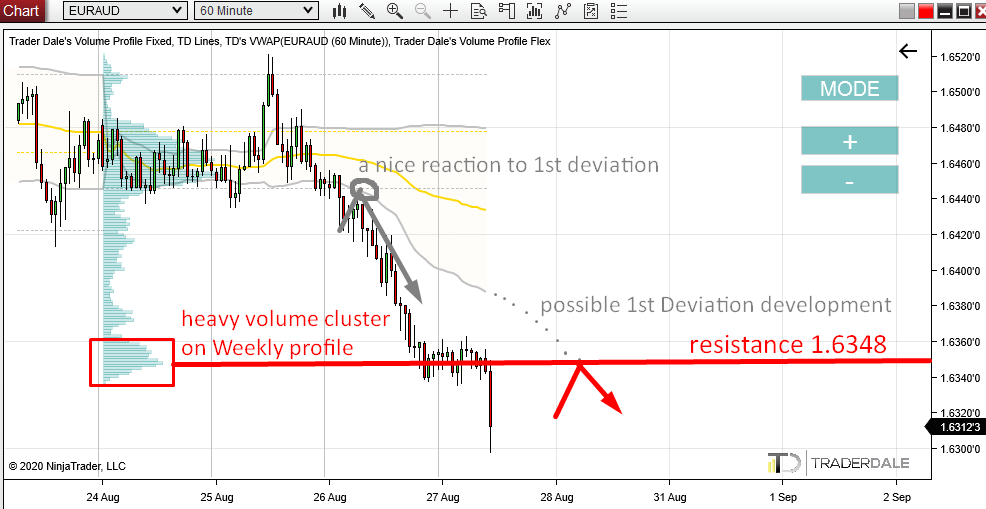
I also like how this situation looks on the 60 Minute chart with Weekly Volume Profile and Weekly VWAP.
Weekly Volume Profile
The Weekly Volume Profile shows a nice volume cluster at the resistance. This means that those volumes we spoke of are also significant from higher (weekly) perspective.
Weekly VWAP
The 1st Deviation of Weekly VWAP (the grey line) is showing a trend. There already was one nice reaction to it (based on a VWAP Trend Setup).
Now, the 1st Deviation is heading downwards and it is quite possible that it will reach the area around our resistance (1.6348).
If it does reach it at the same moment as the price retraces there, it would be a really nice signal confluence of VWAP and Volume Profile setups.
Let’s wait and see…
Below is EUR/AUD 60 Minute chart with Weekly Volume Profile and Weekly VWAP indicator:
Be careful of aggressive Rejection
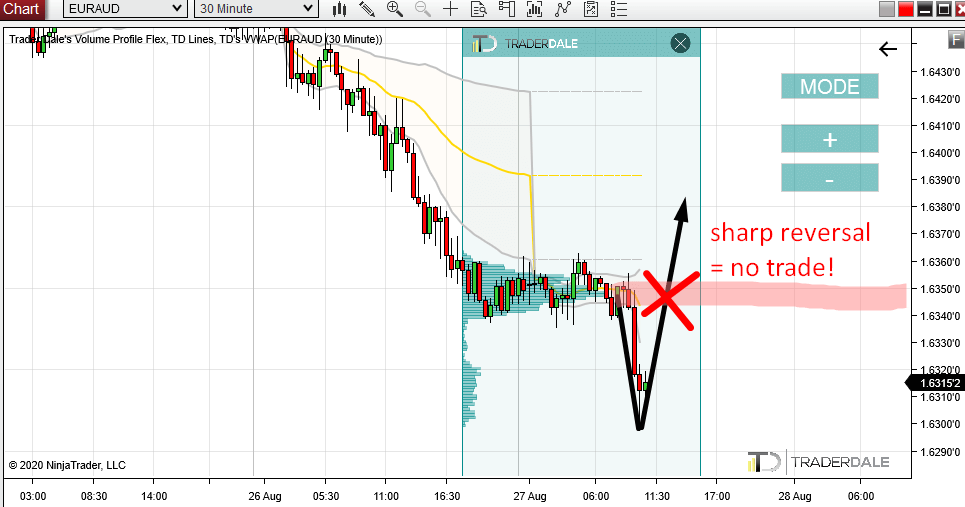
As i said in the beginning, this resistance is still fresh. There could be aggressive buyers waiting. Those aggressive buyers could cause a strong rejection of lower prices.
So, if there is an aggressive rejection (like I draw in the picture below) then it would mean aggressive buyers are present and a short trade form the 1.6348 resistance would be risky.
You always need to be careful about a scenario like this when trading freshly formed levels.
I hope you guys liked today’s analysis. Let me know what you think in the comments below!
Happy trading!
-Dale