
Today, I will do a swing trading analysis of NZD/CAD.
For my swing trading, I prefer to use the Daily time frame, so today’s analysis will be on the Daily.
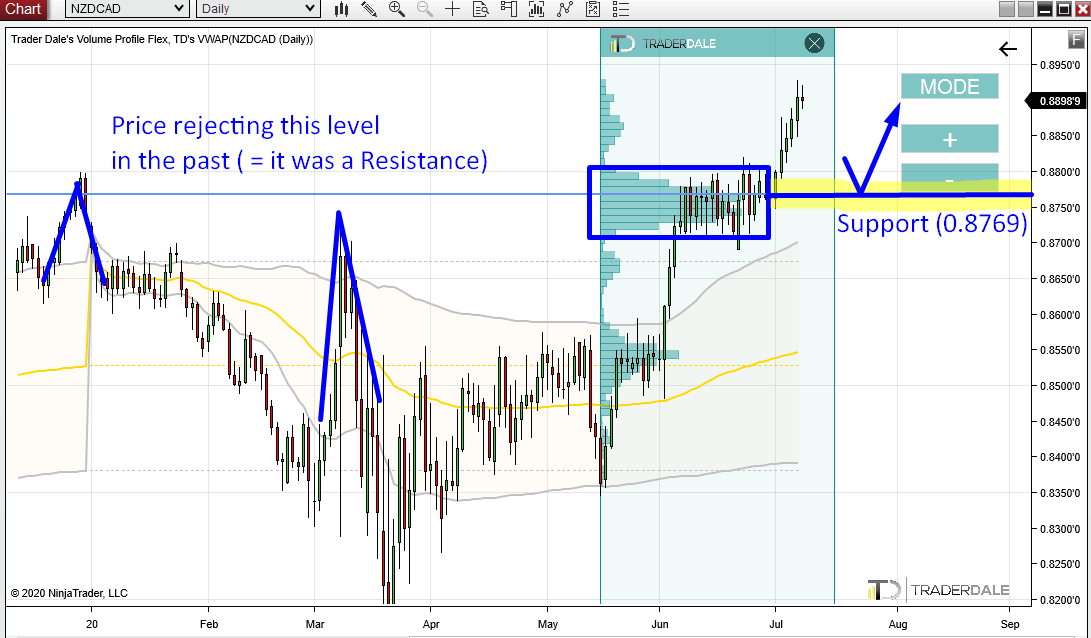
NZD/CAD has formed a new uptrend. Within this uptrend there are two significant volume zones. In this article, I will talk about the first one which was formed around 0.8769 level.
Volume Profile analysis
The reason, why this zone is significant for me is that there is my “Trend setup“.
As the price was progressing upwards aggressively, it stopped for almost a month and there was a tight price rotation.
From that rotation, the price went upwards again and it has been rising since the start of this month.
When I used my Flexible Volume Profile and looked into that uptrend, I saw that there were massive volumes accumulated in that rotation which took place in June.
From that rotation, the price continued upwards again. This means that buyers were adding to their long positions there (in that rotation) and then they started pushing the price upwards again (with aggressive Market orders).
When there is a pullback to this area again (0.8769), I think that those buyers will defend their long positions and that they will try and push the price upwards again.
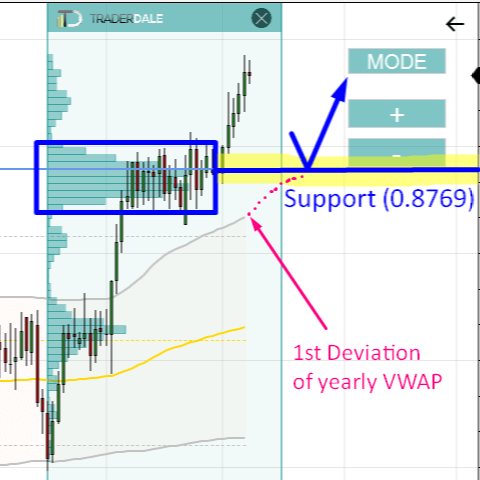
That’s why I think this 0.8769 area will work as a strong support.
Recommended Forex Broker
Price Action analysis
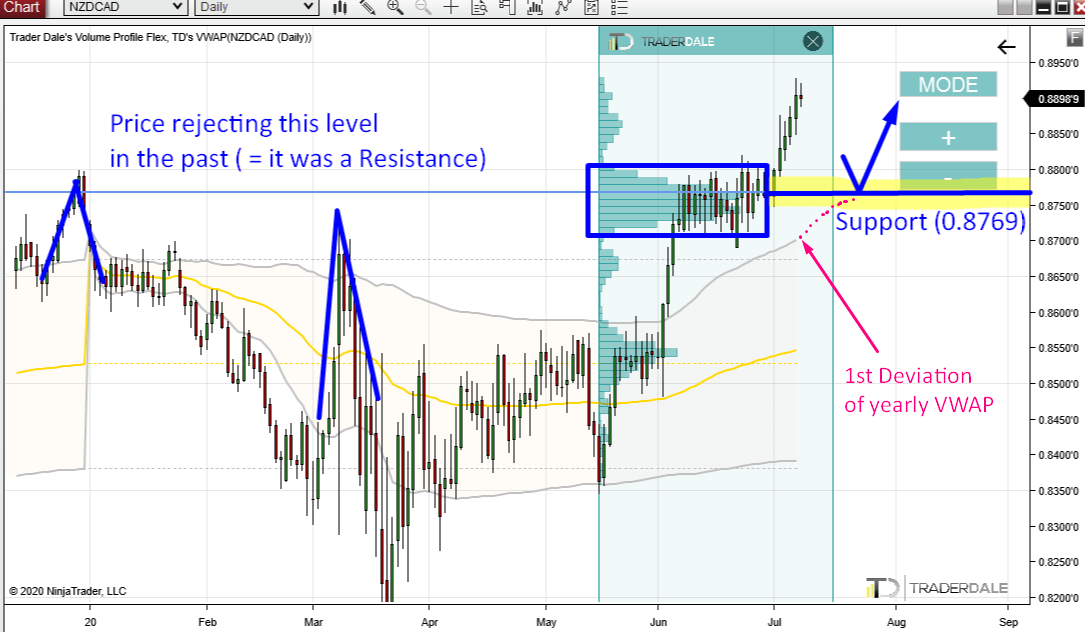
There is also a nice Price Action confirmation of this zone. If you look at the picture, you can see that the price made two strong reactions of this area in the past. I marked them in the picture as well.
These rejections tell us, that this area worked as a strong Resistance. When the resistance got breached a few days ago, then it became a Support.
This is an old (but good) Price Action setup I like to look for. You can learn more about it here:
Support→Resistance: Price Action Setup
In this case, this setup supports the volume-based “Trend Setup“.
VWAP analysis
There is also one more thing to this puzzle. It is a nice confluence with VWAP.
For my swing trade analysis, I use the Yearly VWAP and its 1st deviations. Simply put, these deviations (grey lines) represent supports and resistances.
Currently the 1st deviation is below the 0.8769 support, but if the price stays above the level for a few more days, then the deviation is likely to move upwards (towards the 0.8769 support).
If the 1st deviation is around this support when the price makes a pullback there (to 0.8769), then it will be another confirmation of the level.
A third one! We would have the Volume-based setup, Price Action Setup, and VWAP setup.
That’s how I like to trade – with confluences like these! The more confluences, the better!
You can learn more about VWAP in this Beginners guide here:
I hope you guys liked today’s analysis!
Let me know what you think in the comments below.
Happy trading,
-Dale
Nice setup. What kind of TP and SL do you recommend for this trade and why? That would be really helpful to understand how to find and how to trade it.
Hello, and thank you. The point of this article was not really to give tips like where place TP and SL, however you can learn how I place SL and TP with my swing trades in this free webinar I had: https://www.trader-dale.com/swing-trading-with-volume-profile-webinar-learn-to-trade/
Hi,
Great set up! May I ask why you have also not chosen the level around 0.8550? The cluster seems pretty visible according to your screenshot and it seems like in the past it acted as a Resistance area so it would act as a Support now which is another confluence.
Thanks.
Yea, that’s also a good one. I just did not want to make the article too long and I wanted to talk about one level only. It is a good level though.