
Hello guys,
there is a nice day trading opportunity on NZD/CHF. Let me show you!
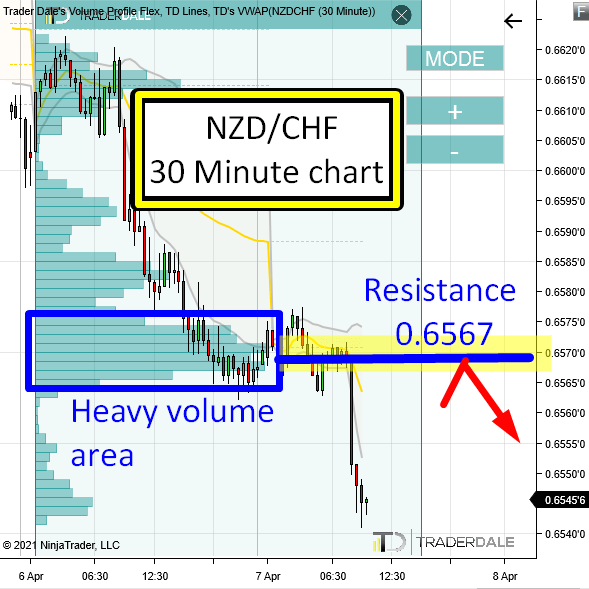
There was a sideways price channel (a rotation) in the late US session yesterday and in today’s Asian session on NZD/CHF.
From this rotation, a strong sell-off (downtrend) started.
A rotation followed by a sell-off is what I like to see. Because this is how my favorite Volume Profile Setup looks like!
Volume Profile Setup
The setup is called the “Volume Accumulation Setup” and it goes like this:
First, you want to see a rotation where heavy volumes got accumulated (you can tell by using a Volume profile indicator). Then you need to see a trend activity – in this case, it is the sell-off.
This tells you that big trading institutions were building up their positions in the rotation area. Then they manipulated the price to go into a sell-off.
This is important because it indicates that it was strong Sellers who were building up their Short positions in that rotation area.
When there is a pullback into that area again, then it is likely that those strong Sellers will want to defend this area. They placed a lot of their positions there and therefore it is important for them.
This is why they should push the price downwards from there again. This makes the area a strong Resistance.
In this case, the Resistance zone is around 0.6567. This is where the volumes were the heaviest.
NZD/CHF; 30 Minute chart:
Do you want ME to help YOU with your trading?
Price Action Setup
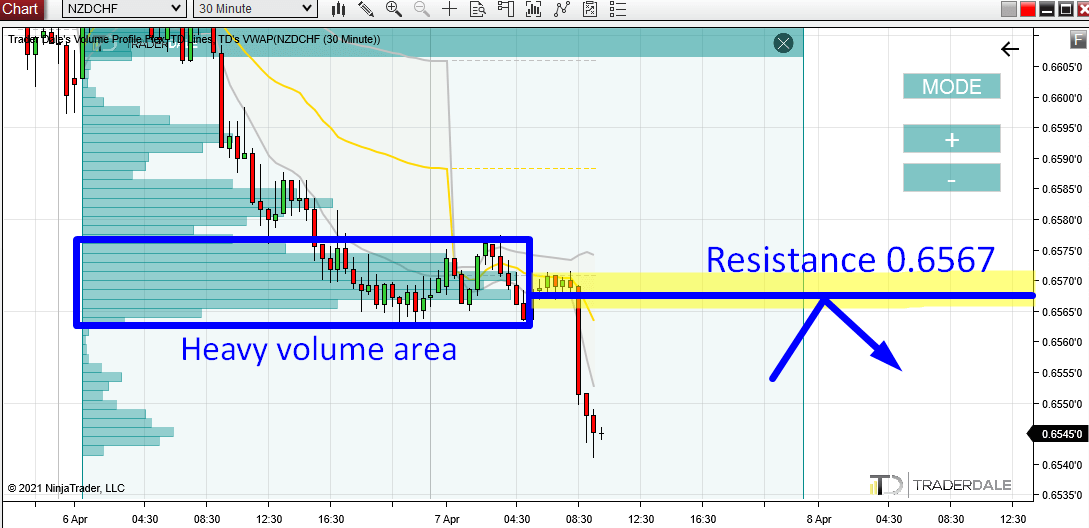
A nice thing about this volume-based Resistance (0.6567) is that there are more independent trading setups that confirm it.
One of them is a Price Action setup called the “Support→Resistance Setup“.
This is super simple setup which says that when a Support gets breached it then becomes a Resistance.
In our case, the 0.6567 area worked as a Support in the past. You can tell because the price bounced nicely off it.
When the price went through that Support earlier today, the Support turned into a new Resistance.
The cool thing is that this resistance is at our volume-based level, that we found using Volume Profile.
NZD/CHF; 60 Minute chart:
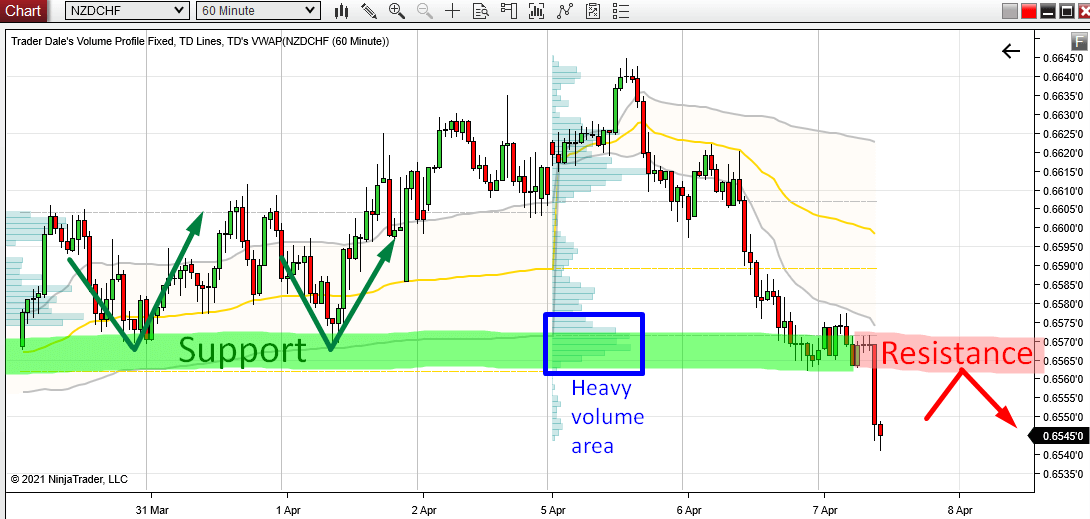
VWAP Setup
One more nice addition to our Resistance is VWAP Setup. This VWAP setup also points to the 0.6567 area!
What I am interested in the most is the grey line. It is 1st Deviation of VWAP. When the price is trending and it moves below it, then the 1st Deviation is supposed to work as a Resistance.
This setup is called the “VWAP Trend Setup“.
Right now, the 1st Deviation is a bit above our 0.6567 Resistance, but it is heading downwards and it is quite likely that when the pullback occurs it will be somewhere around our level.
If that happens, then it will be another nice confirmation of the strength of the 0.6567 Resistance.
NZD/CHF; 60 Minute chart:

I hope you guys liked today’s analysis! Let me know what you think in the comments below.
Happy trading!
-Dale
P.S. Yesterday I published a video where I presented two very good brokers. If you missed it, you can watch it below:
thanx Dale .
Anytime Ahmed! 🙂
Hi Dale,
Thanks again for this new trading ideas.
It’s my biggest pleasure Richard!
Thanks Dale!
Would you say that the NZDUSD is in a similar situation?
I wouldn’t, but you can send me a screenshot and draw what exactly you mean is the similarity so i can maybe understand your idea better.
Cheers!