

Have you ever been stopped out of a good trade by a tiny wick? Then you watched the price turn around and move exactly where you expected. It hurts. The alternative stop loss method is my answer to this problem, and I use it on all my swing trades.
This used to happen to me a lot. My analysis was right, my entry was right, but a small spike took me out. So I changed how I handle my stops. Now I only exit when the daily candle closes past my stop line. A quick wick alone does not end the trade.
In this article, I will teach you the whole method in simple steps. I have traded with Volume Profile for many years, and this approach has saved many of my trades. In many cases, it has turned a potential loser into a winner.
Here is what you will learn:
- Why wicks kick traders out of good positions
- How to place the alternative stop loss line
- What a catastrophic stop loss is and why you need one
- A real example where the method saved the trade
- A real example where it failed, and what I did
You will also see a simple comparison with the standard stop loss. By the end, you can decide which approach fits your own trading. Let us start with the basic idea.
Table of Contents
Summary of the Article in 5 Points
- The alternative stop loss method keeps you in a trade when the price only wicks past your stop.
- You exit manually only when the daily candle closes beyond your stop line.
- Your stop line sits behind a strong barrier, such as a heavy volume zone.
- A catastrophic stop loss, set 50% further away, sits in your platform as a hard stop.
- The method does not win every time, but it saves many good trades from being closed too early.
What Is the Alternative Stop Loss Method?
A normal stop loss is an order in your trading platform. When the price touches it, your trade closes right away. It does not matter if the price touched it for one second or for one week. The result is the same. You are out.
The alternative stop loss method works differently. Instead of a hard order at your stop level, you only draw a line on your chart. You watch that line. You close the trade yourself only if the daily candle closes beyond it.
The Simple Rule Behind It
Here is the rule in one sentence. A wick is not a close. If the price pokes through your line during the day but closes back inside, you stay in the trade.
Let us make this clear with a short trade. Say your stop line is above a resistance zone. During the day, the price spikes above your line. Then it falls back down. At the end of the day, the candle closes below your line. In this case, you do nothing. Your trade is still alive.
Now imagine the daily candle actually closes above your line. That is a different story. The market has accepted the higher price. Now you close the trade manually.
What Happens | Standard Stop Loss | Alternative Stop Loss |
Price wicks past the stop, closes back inside | Trade closed | Trade stays open |
Daily candle closes past the stop | Trade closed | Trade closed manually |
Price hits the catastrophic stop | Not used | Trade closed automatically |
Why I Use It for Swing Trades
I use this method for all my swing trades. Swing trades last days or even weeks. Over that time, the price will often make sharp moves that do not change the bigger picture.
A daily close gives a much clearer message than a quick spike. It shows where the market actually settled. That is why the daily candle is my judge, not a random wick.
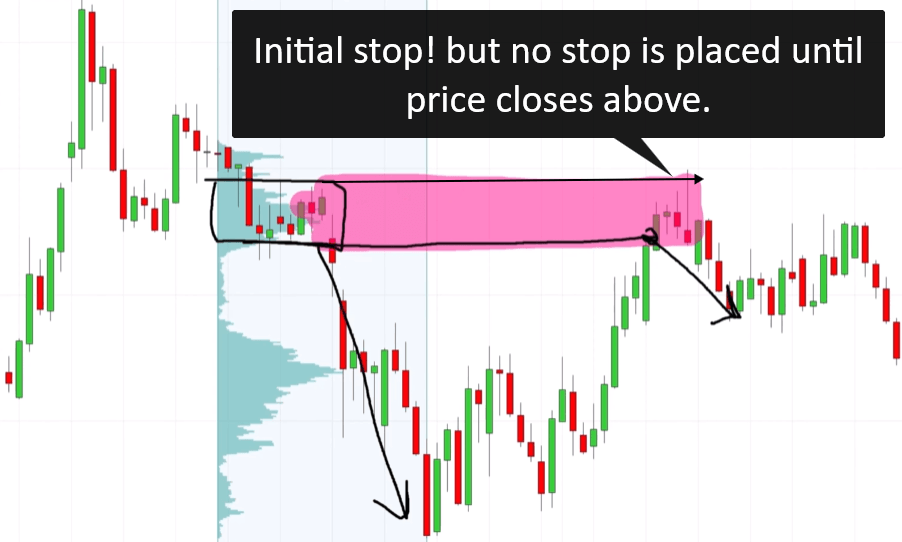
Why Do Small Wicks Kick You Out of Good Trades?
Before we go further, it helps to understand why these wicks happen at all. Once you see the reason, the alternative stop loss idea makes a lot more sense.
Liquidity Above Highs and Below Lows
Most traders place their stops in obvious places. For a short trade, that means just above a recent high. For a long trade, it means just below a recent low.
This creates a cluster of orders in those spots. When the price reaches them, all those stops trigger at once. Many of them are buy orders for short traders, which pushes the price up for a moment. Big players often use this burst of orders to fill their own positions.
So the price quickly collects liquidity above the highs. After that, it often turns around and moves back in the original direction. For you, this looks like a wick. Your stop got hit, and then the market went your way without you.
False Breakouts
Sometimes the price breaks a level and looks like it will keep going. Then it fails and comes back. This is a false breakout. It can happen within a few hours on a daily chart.
If your hard stop is just behind the level, a false breakout will take you out. If you use a daily close rule, you can ride through it. The daily candle simply shows that the breakout did not hold.
What This Means for Your Trading
Being stopped out like this is frustrating. Your analysis was correct. Your level held. But you still took a loss. Worse, you missed the profit that came after.
This happened to me so many times that I decided to change my approach. That decision led to the alternative stop loss method. It does not remove risk. It simply stops random spikes from making the decision for you.
How to Place Your Alternative Stop Loss Line
The alternative stop loss method only works if your line is in the right place. A random line will not help you. Your line needs to sit behind a strong barrier.
Step 1: Find a Heavy Volume Zone
I use Volume Profile to find heavy volume zones. These are areas where a lot of trading took place. When the price leaves such a zone with a strong move, the zone often acts as support or resistance later.
In my first example, there was a heavy volume zone followed by a strong sell off. That told me sellers were in control there.
Step 2: Plan Your Entry
For a short trade, I want to sell from the beginning of that heavy volume zone. That is the first place where sellers are likely to step in again. So my entry sits at the lower edge of the zone.
If you want to learn more about this kind of entry, read my article on [Volume Profile pullback trading] .
Step 3: Place the Line Behind the Barrier
Now I place my stop line behind the barrier. In this case, the barrier is the heavy volume zone itself. So my line goes just above the top of that zone.
Why behind the barrier? The price needs to break through the whole zone to reach my line. If it does that and closes there on a daily basis, my trade idea is no longer valid.
Step 4: Keep the Line Off Your Platform
Here is the key part. In my platform, I do not place a stop order at this line. It is only a drawn line that I watch.
That means I need to check my charts every evening after the daily close. If the daily candle closed past my line, I close the trade by hand. If it did not, I keep the trade open.
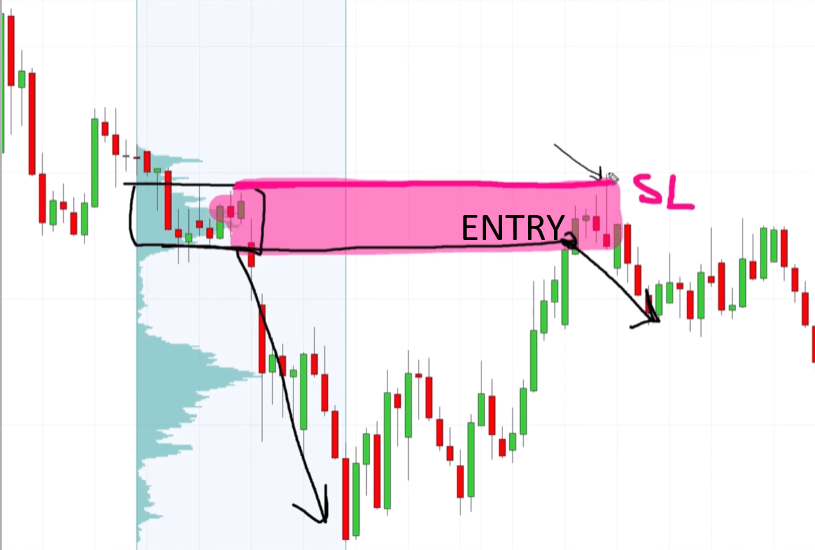
The Catastrophic Stop Loss: Your Safety Net
At this point, you may be worried. If there is no stop order in the platform, what happens if the market moves sharply against you? That is a fair question. The answer is the catastrophic stop loss.
What Is a Catastrophic Stop Loss?
The catastrophic stop loss is a hard set stop in your platform. It is a real order. If the price touches it, you are out automatically. There is no waiting for the daily close.
Its job is simple. It protects you from massive losses. Markets can move fast on big news. You might also be away from your screen. The catastrophic stop makes sure one bad day can never wipe out your account.
How Far Away Should It Be?
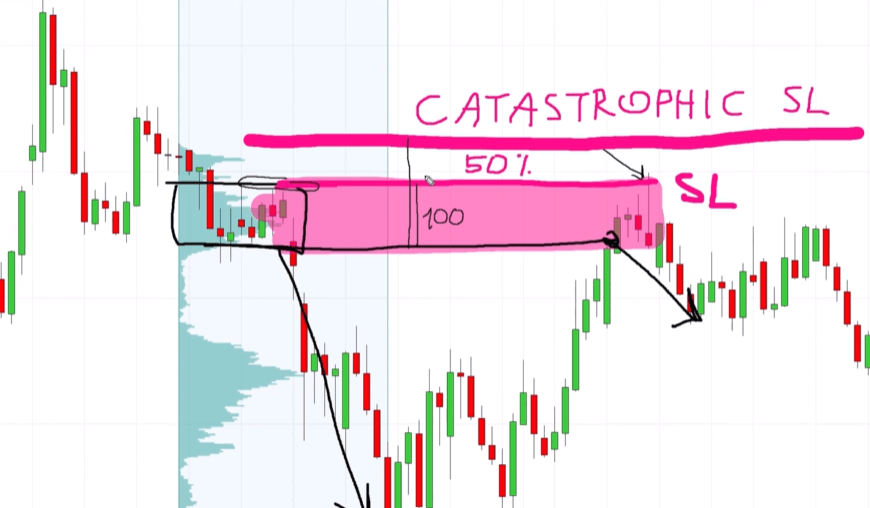
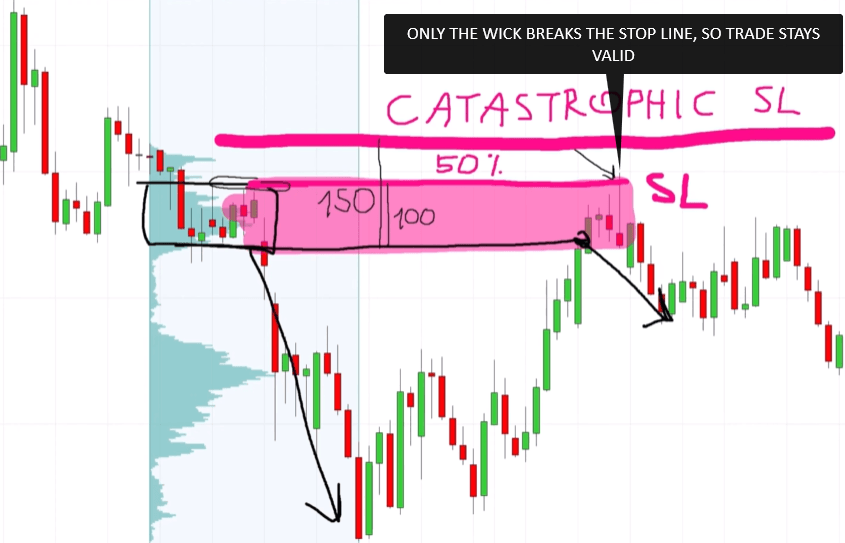
I place my catastrophic stop 50% further away than my normal stop line. Here is a simple way to calculate it:
- Measure the distance from your entry to your stop line.
- Multiply that distance by 1.5.
- Place the catastrophic stop at that distance from your entry.
For example, if my stop line is 100 pips from entry, my catastrophic stop is 150 pips from entry.
Stop Line Distance | Catastrophic Stop Distance |
50 pips | 75 pips |
80 pips | 120 pips |
100 pips | 150 pips |
150 pips | 225 pips |
Two Stops, Two Jobs
Think of it like a house with two locks. The stop line is the door you check every evening. The catastrophic stop is the alarm that goes off automatically if someone breaks in.
- Stop line: watched by you, used only on a daily close
- Catastrophic stop: placed in the platform, triggers on touch
One more thing to keep in mind. Your worst case loss is now the catastrophic stop distance, not the stop line distance. Keep that in mind when you plan your risk. My article on [consistent position sizing] explains how to keep the same risk on every trade.
Example 1: When the Alternative Stop Loss Method Saves the Trade
Now let us look at a case where the alternative stop loss method did exactly what it was designed to do.
The Setup
There was a clear heavy volume zone on the chart. After that zone, the price dropped in a strong sell off. This told me that sellers were active in that area.
My plan was to go short from the beginning of the heavy volume zone when the price came back up. My stop line went behind the zone, above its top edge.
What Happened Next
The price pulled back into the zone, and my short was triggered. At first, everything looked fine. Then the price pushed higher. During one day, a candle spiked above my stop line.
With a normal hard stop, my trade would have closed right there at a loss. But this was only a wick. By the end of the day, the candle closed back below my line.
So I stayed in the trade. I did not panic, and I did not move my line. Maybe the market was collecting liquidity above the highs. Maybe it was a small false breakout. Either way, the daily close told me my level was still holding.
The Result
After that wick, the price turned down. It moved strongly in my direction, and it did not come back to my line again. The trade that would have been a loser became a winner.
Event | Standard Stop | Alternative Stop |
Price wicks above the line | Stopped out at a loss | Still in the trade |
Daily candle closes below the line | Already out | Trade continues |
Price drops toward target | Missed the move | Trade becomes a winner |
This is the exact situation that used to frustrate me so much. My analysis was right, but the wick decided the outcome. With this method, the daily close decides instead.
Example 2: When the Alternative Stop Loss Fails
No method works every time. It is just as important to see a losing example. This shows you how to act when the method does not help.
The Setup
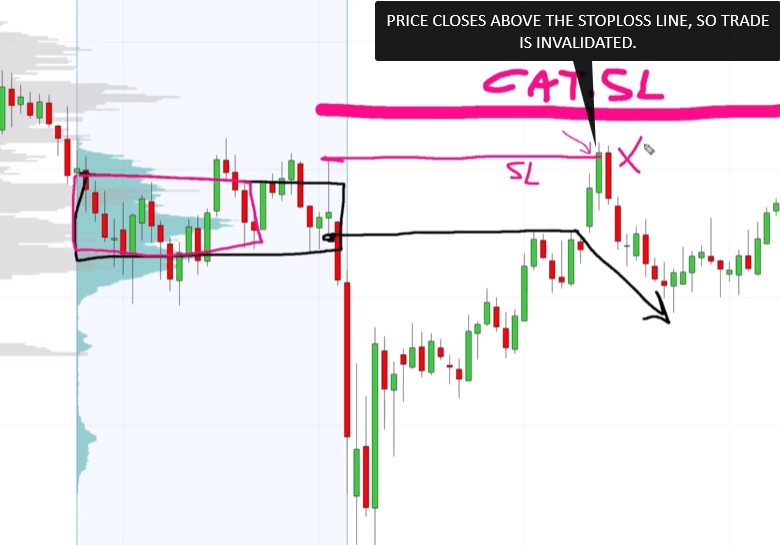
Again, there was a heavy volume zone. This time, I planned to enter at the beginning of a fair value gap inside the area. That was my short entry. If you are new to this concept, my article on [fair value gaps] explains it step by step.
For the stop, I looked for the barrier. I placed my stop line at the top of a small swing point behind the heavy volume zone. The catastrophic stop sat 50% further away.
What Happened Next
The price moved up against me. This time, it did not just wick through. The daily candle closed above my stop line.
That was my signal. When I see a daily close past the line, I do not hope or wait. I terminate the trade. I closed it manually at the daily close and took the loss.
What to Learn From It
What to Learn From It
This example teaches three simple lessons:
- Follow the rule. A daily close past the line means you exit. No exceptions.
- Losses are normal. Over time, the method improves results, but it does not stop every loss.
- The catastrophic stop was not needed. My daily close rule got me out first.
Check | Example 1 | Example 2 |
Entry | Start of heavy volume zone | Start of fair value gap |
Stop line | Behind heavy volume zone | Above small swing point |
What crossed the line | Only a wick | A full daily close |
Action | Stayed in | Closed manually |
Result | Winner | Loss |
Some traders find this part hard. When you see a loss forming, it is tempting to give the trade “one more day.” Do not do that. The daily close rule only works if you respect it every single time.
Standard Stop vs Alternative Stop: Which One Fits You?
So, which stop should you use? Both can work. It depends on your style, your schedule and your personality. Some traders love the freedom of a daily close rule. Others feel calmer when every exit is automatic. Neither choice is wrong. What matters is that you pick one approach and follow it with discipline on every trade.
Side by Side Comparison
Feature | Standard Stop Loss | Alternative Stop Loss Method |
Where the stop lives | Order in the platform | Line on the chart plus a catastrophic stop |
What closes the trade | Any touch | Daily close past the line |
Protection from wicks | Low | High |
Worst case loss | Stop distance | Catastrophic stop distance |
Time needed | Very little | Check charts every evening |
Best for | Any trader | Swing traders |
When the Alternative Method Makes Sense
The alternative stop loss method fits you well if:
- Your trades are swing trades that last days or weeks.
- You can check your charts every evening after the daily close.
- Closing a trade by hand when the rule says so is easy for you, because you have the discipline.
- Wicks often stop you out before the price moves your way.
When the Standard Stop Is Better
A standard stop may suit you better if:
- Your trades are short, such as intraday trades.
- You cannot check the charts each evening.
- Fully automatic exits feel more comfortable to you.
If you are not ready for the alternative method, that is fine. Just keep using the standard stop loss. It still protects you, and it is simple to manage. A simple method you follow is better than a clever one you ignore.
From my own experience, though, the alternative method has saved my trades many times. Over time, it has given me better results than a standard stop. That is why I prefer it, and it is the approach I teach my students.
Final Thoughts
The alternative stop loss method solves one of the most frustrating problems in trading. You no longer lose good trades to a tiny wick that reverses a moment later. Instead, the daily close decides whether your trade idea is still valid.
Let us review the key points. First, place your stop line behind a strong barrier, such as a heavy volume zone. Second, keep that line off your platform and check it every evening. Third, close the trade manually only when a daily candle closes beyond the line.
Safety still matters. That is why you always set a catastrophic stop loss in your platform. Place it 50% further away than your stop line. It protects you from big, fast moves when you are not watching.
You also saw that the method is not perfect. In the first example, it saved the trade and turned a loss into a win. In the second, the daily candle closed past the line, and I took the loss. Both results are part of the process.
My advice is simple. Try the method on your next few swing trades. Write down how often a wick would have stopped you out. Then compare the results with a standard stop. Your own numbers will show you which approach fits you best.
FAQ
What is the alternative stop loss method?
It is a way of managing stops where you only exit when the daily candle closes beyond your stop line. A wick through the line does not close the trade. A hard catastrophic stop protects you from large losses.
How far should the catastrophic stop loss be?
Place it 50% further from your entry than your normal stop line. For example, if your stop line is 100 pips away, your catastrophic stop goes 150 pips away.
Can I use this method for day trading?
It is designed for swing trades on the daily chart. For short intraday trades, a standard stop loss is usually simpler and more practical.
Learn the Full Volume Profile Strategy
If you want to learn my complete trading strategy, including how I find heavy volume zones and manage my stops, I can help. My course walks you through it step by step, and you also get my custom made trading tools.
Visit trader-dale.com and click Trading Course and Tools. It will take you straight to the page with my course and indicators.
