This article is a part of a four-part Beginners Guide to Stock Investing. Here are links to all parts:
In this article, we will talk about stock fundamentals and how to use them to pick the right stocks.
There are many fundamentals, ratios, and models that investors follow. This article will break down the different aspects I view as critical.
Specifically, we will cover the P/E ratio, P/B ratio, and Debt/Equity. Let’s now have a look at them one-by-one.
P/E (Price to Earnings Ratio)
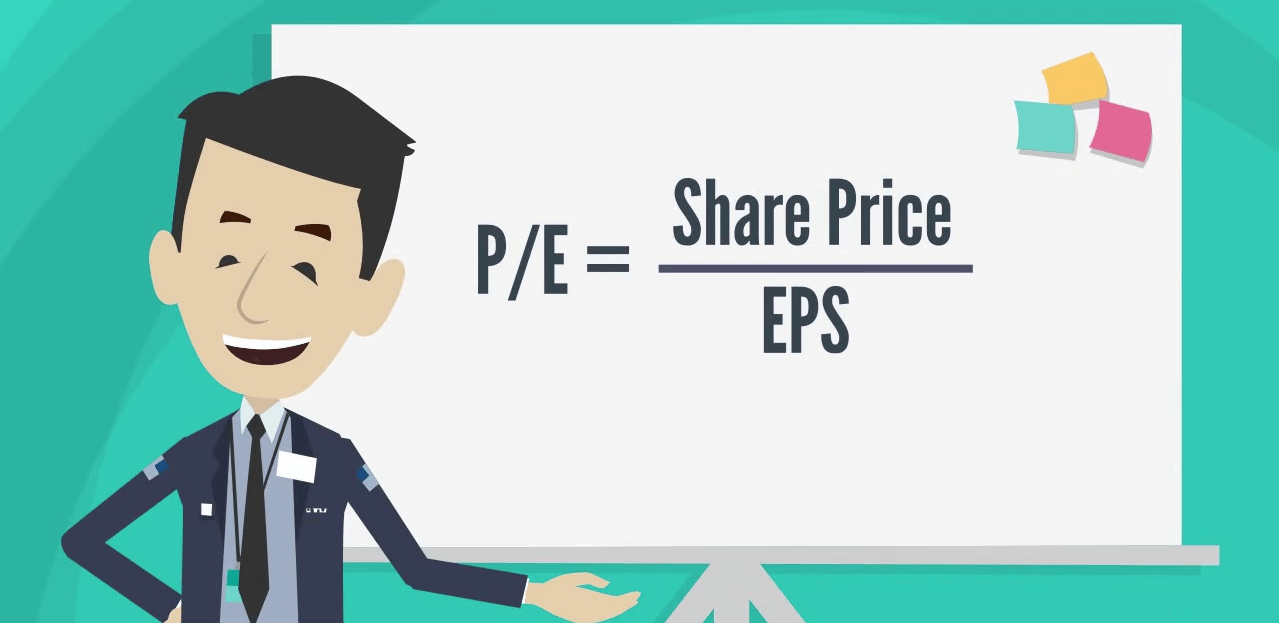
Calculation formula: Current Stock Price / Earnings per share (EPS)
*EPS tells you how much the company actually made after deducting all expenses.
What’s P/E ratio?
When it comes to evaluating stocks, The P/E ratio is probably the most used ratio. It tells us very important information about the stock – how much money is your company making related to how much you paid for it.
P/E ratio tells us how much you pay now to receive $1 of the company earnings.
You can also look at it this way: P/E ratio tells you how many years it will take the company to earn the money you paid for your stocks.
The smaller the P/E the better. The smaller the number, the faster the company will make your invested money back.
Example: Stock price is $100/share. Having one stock of this company makes you $10/year. In this case it will take 10 years to cover the investment. In 10 years, the company will earn you the money you invested in it ($100/$10) = 10 years. This means P/E = 10.
Currently, the P/E ratio of an average company from the S&P 500 index is 16. This means that you need to pay $16 now to receive $1 of the company’s earnings in the future.
Companies with the highest P/E are usually from the most popular and fast-growing sectors like the Technology sector. The reason is that prices of these stocks are inflated with no earnings (EPS) to back it up. Investors simply believe that those companies will have way bigger Earnings in the future than they have now.
P/E is changing over time
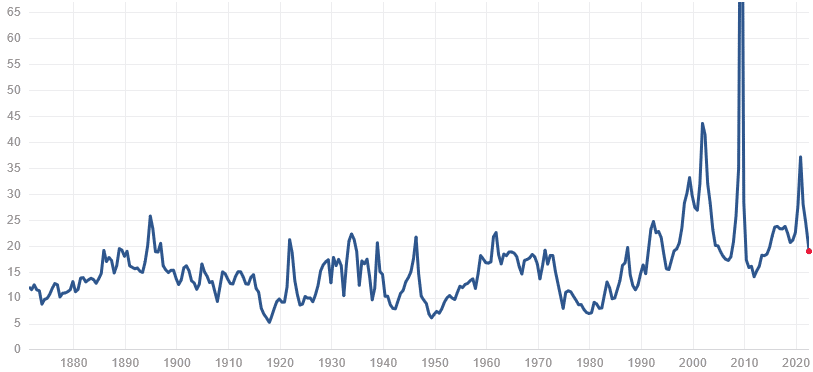
Keep in mind that P/E is changing over time. It depends on the current market price and current earnings. Both those variables are changing over time. Here is how P/E ratio of an average stock from the S&P 500 index changed over time. BTW notice what happened around years 2000 (dot-com bubble) and 2008 (financial crisis):
P/B (Price to Book Ratio)
Calculation formula:
P/B = Current Stock Price/Book Value
*Book Value = Total Assets (what the company has) – total Liabilities (what the company owes)
What’s P/B ratio?
Each company owns some assets that they use to operate their business. It could be land, offices, computers, cars, factories, machines, licenses, … All those things are called assets. The Book Value represents value of all those assets after deduction of what the company owes to banks, creditors, …
A good investor should be aware of the Book Value because if in a critical scenario a company goes bankrupt, then investors won’t lose all their investment. What will happen is that all the assets of the company will get sold (machines, buildings, land, other properties…), the company debt will be paid, and then the rest of the money will go back to the investors. The bigger the Book Value, the more money will go back to investors.
This means you want the P/B ratio as low as possible (the bigger the Book Value, the smaller the P/B ratio).
Companies with big Book value (and small P/B ratio)
Companies with high Book Value are typically companies that need to invest significant amounts of money into tangible assets (factories, heavy machinery, land, infrastructure,… ) to operate their business.
Typical examples of companies that hold expensive assets are companies from Energy sector, Industrials sector, and Utilities sector.
As an investor, you want a company that has low P/B because this means that the company has a high Book Value related to it’s current price.
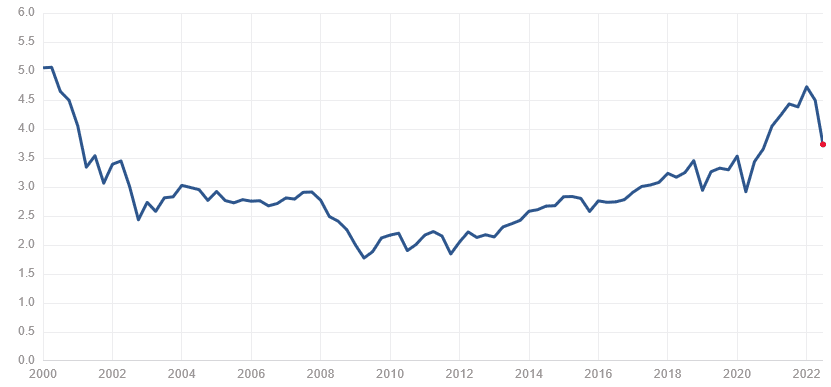
P/B is changing over time
Keep in mind that P/B is changing over time. It depends on the current market price and on current Book Value. Both those variables are changing over time. Here is how P/B ratio of an average stock from the S&P 500 index changed over time. Again, notice what happened around years 2000 (dot-com bubble) and 2008 (financial crisis):
Debt/Equity

Debt/Equity is a ratio that compares the company Debt to its Equity – in other words it tells us how much leverage the company is using. It tells us whether the company is financing their operations through Debt or with company funds.
Example
A company’s equity is $10bln, and they borrowed $5bln. Debt/Equity will be $5bln/$10bln = 0.5 (=50%).
No Debt = good Debt?
Our common sense tells us that it is better if a company is not in debt and it’s able to finance its business using its own funds, right? Well, in this case, being without any debt may not be the best way to go.
Debt can be good because it allows a company to grow faster than it would grow without the Debt. Imagine that you have a great and proven business model that works and that you need to scale it to make more money. To scale a business, you typically need a lot of money. If you want to do this quickly and get ahead of competitors, then you need to borrow some. You need Debt.
So, Debt can be good, but too much Debt could prove to be risky. You need to find the sweet spot between a healthy portion of Debt and too much Debt that could ruin your business. The thing is, that if you borrow money, you need to pay interest. If the economy is booming and you are doing great, then paying the interest is not a problem. But if the economy starts to slow down and goes into a recession, then your company is making less and less. In such a case, too much debt could be deadly as you may not be able to pay the interest anymore.
I prefer companies that have debt around, or below 60-70%. If a company debt is over 100%, then I consider the investment riskier.
Some of the higher-debt sectors are: Utilities, Energy (because large investments are needed there), Financials (because banks borrow money to lend money), and Real Estate.
The smaller Debt is generally in sectors like: Healthcare, or Technology.
Finviz stock screener
Link: FINVIZ Screener
The Finviz stock screener is a freely available online tool I would highly recommend using. It has a huge database with hundreds of stocks and detailed info about each of them.
You can use the screener to filter out bad/risky stocks with only a few clicks and narrow down your search very easily. And the best part – you don’t really need to be an expert to do this!
How to use it?
The Finviz stock screener has three tabs to use when looking for viable stocks. The tabs are called: Descriptive tab, Fundamental tab, and Technical tab.
Today, we talked about P/E, P/B, and Debt/Equity. You will find these in the Fundamental tab (click to enlarge):
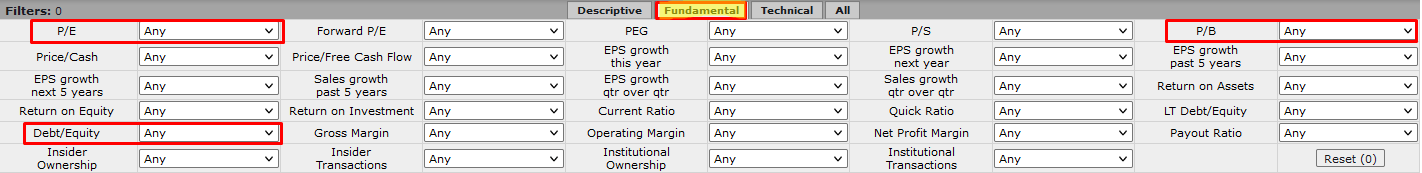
You can adjust the parameters there and use it as a starting point for looking for good stocks.
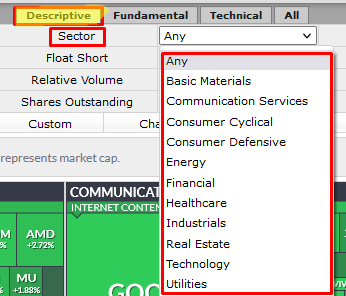
If you want to look for stocks only in some sectors (and I really recommend doing this), then you need to select the sector in the Descriptive tab:
This should give you a good starting point in looking for the right stock investments! If you would like to learn more about picking good stocks (and much, much more), then I recommend checking out my new Stock Investing Course:
Stock Investing Course

Want to get a complete A-Z course on stock investing? We’ve got you covered! In my brand new course, I will teach you everything you need in a series of 70 videos (15+ hours total) and give you all the indicators & tools you are going to need along the way!
What’s next?
In the next part, we will focus on choosing the right moment for making your investment. For this, we will use my favourite tool: Volume Profile. See you there!
This article is a part of a four-part Beginners Guide to Stock Investing. Here are links to all parts: