Hello guys,
in yesterday’s Trading ideas video, I was showing you how to use Volume Profile when there is a trend. Today, I am going to continue with this topic and show you one more example.
This time it will be a current uptrend on CAD/CHF.
This uptrend started on 21st June and lasted until 23 June.
What Happens In A Trend
What happens in an uptrend is that strong aggressive Buyers are pushing the price upwards. BUT they need to enter their Long positions somewhere! Big institutional traders can’t just open a trading position with one click of their mouse like you or me. They need time to enter their trades since they have way more trading capital than we do.
What they need is a little rotation inside the trend. In such a rotation, they are able to place their trading orders.
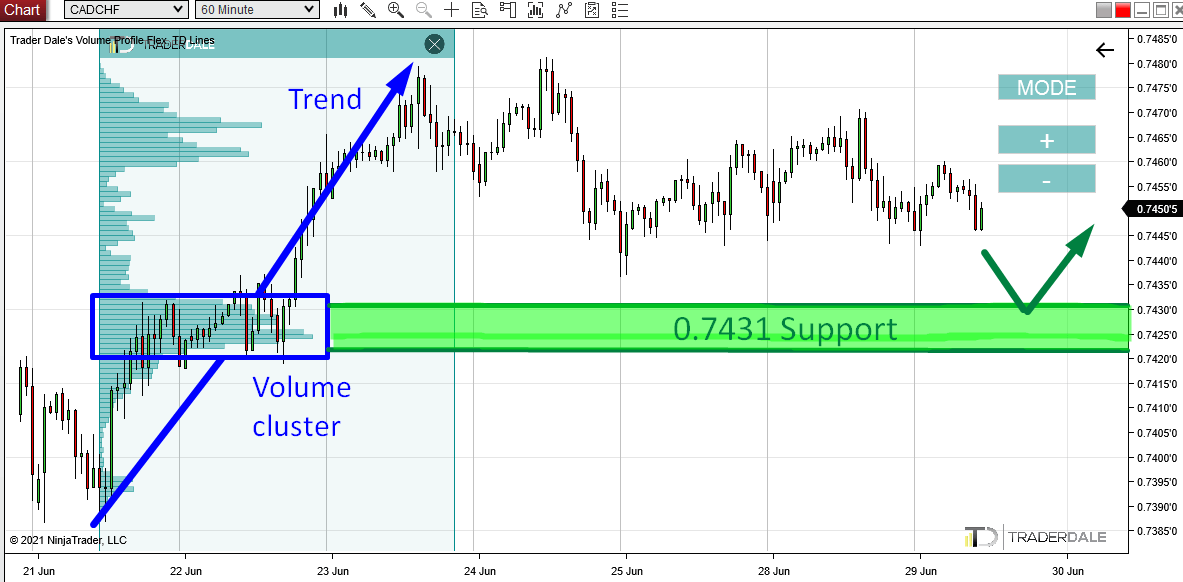
Since we are all about tracking the BIG guys, we want to identify where they placed their Longs there. The simplest way is to use my Flexible Volume Profile and stretch it over the whole trend area. Like in the picture below:
CAD/CHF; 60 Minute chart:

Volume Profile Analysis
As you can see from the picture above, there was an uptrend. Inside this uptrend there was a significant Volume Cluster.
This Volume Cluster shows us the area where the strong Buyers were adding massively to their Long trading positions.
Then they pushed the price upwards some more and the uptrend continued.
So what do we do? Now we know that there were strong Buyers in the heavy volume area starting at 0.7431. Those strong Buyers will want to defend this area. It is important for them because they placed a lot of their Longs there.
For this reason, when the price makes it back to the area (starting at 0.7431), those Buyers will try and push the price upwards from there again.
This is what will make it a strong Support.
This setup is called the “Volume Profile – Trend Setup“
I hope you guys liked my analysis! Let me know what you think in the comments below!
Happy trading,
-Dale


