

Hello guys,
in today’s day trading analysis I will talk about EUR/AUD.
What I like about the situation on this pair right now is that three independent trading setups point me to the same trading level – a strong Support around 1.5802.
Let me now talk about those three setups one-by-one!
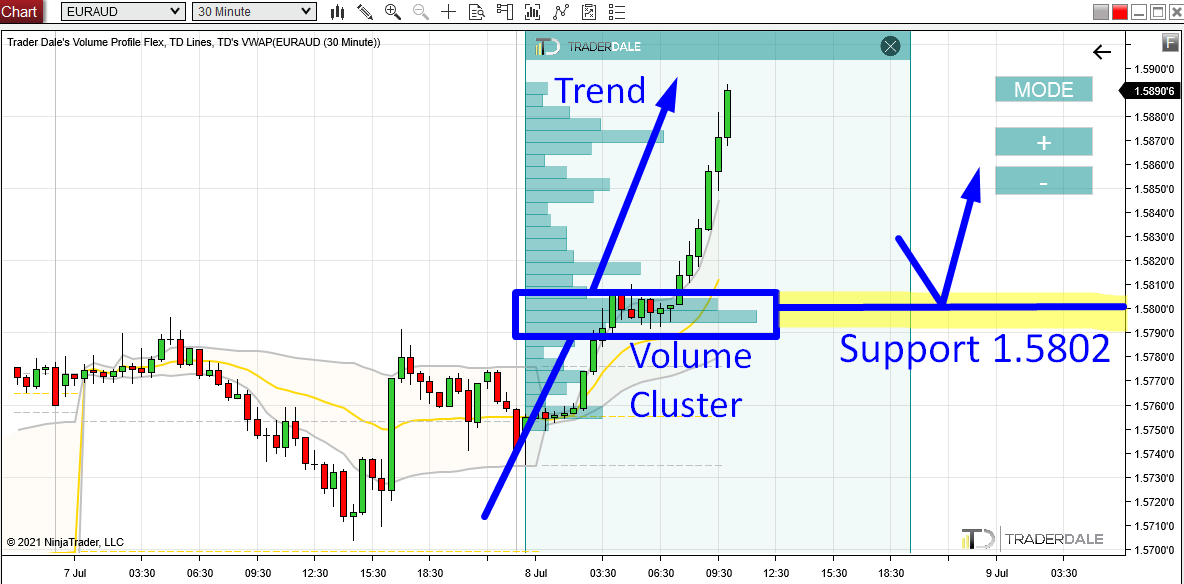
Volume Profile Setup
The EUR/AUD is currently moving aggressively upwards. It seems that strong Institutional Buyers are manipulating the price upwards (using Market Orders).
When there is a trend like this, then I use my Flexible Volume Profile to look into this trend. What I look for are significant volume areas that show up on the profile. Those are sort of “bumps” which I call Volume Clusters.
Those Volume Clusters represent significant places where the BIG guys (institutions) were active and where they placed a lot of their orders.
The BIG guys usually defend those zones. They are important for them since they placed a lot of their trades there.
That’s why the Volume Clusters that got created within a trend work as strong Supports.
Such Volume Cluster is on the EUR/AUD right now.
This Volume Profile Setup is called the “Trend Setup” and the Support it reveals is at 1.5802.
EUR/AUD, 30 Minute chart:
Do you want ME to help YOU with your trading?
Price Action Setup
The next setup that points to the same Support area around 1.5802 is based on Price Action.
If you look at the chart again and look at the places where the price reacted yesterday, then you can notice that it bounced off the 1.5802 area twice.
Because of those two strong reactions we can now tell, that it was a strong Resistance yesterday. Now, the price blew past this Resistance and the Resistance Became a Support.
This is an old Price Action Setup that says that breached Resistance becomes a Support. This is not my trading setup, but I still like to look for it and place my trades based on it. Especially when it aligns with my Volume Profile Setups.
You can learn more about this Price Action Setup here:
PRICE ACTION: Resistance → Support (and vice versa)
EUR/AUD; 30 Minute chart:

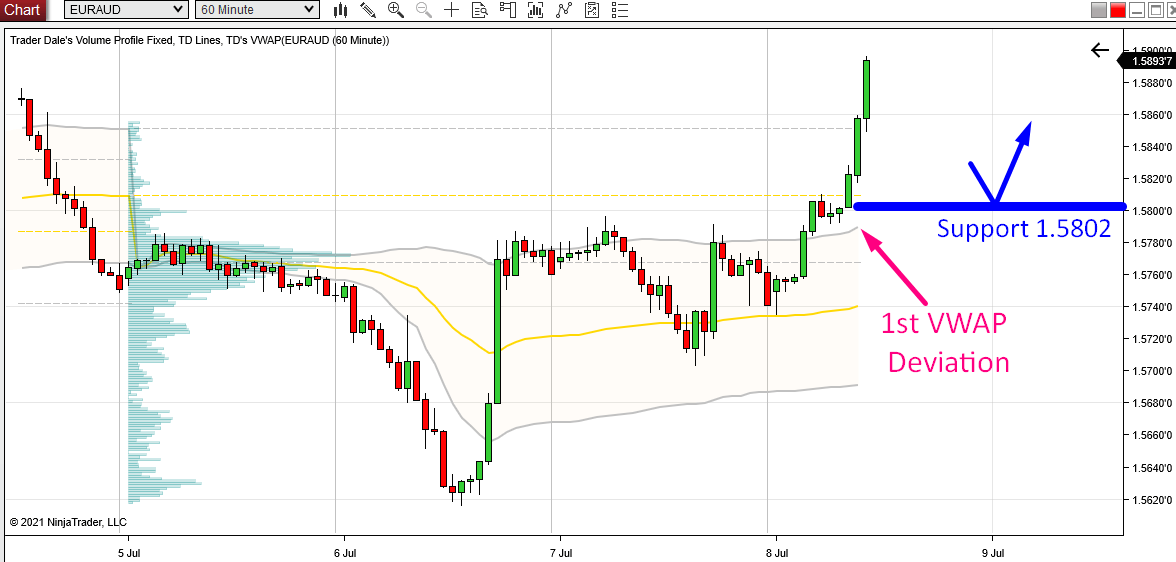
VWAP Setup
The third setup that points to the 1.5802 area is a “VWAP Trend Setup“.
With this one, you want to see the price go above the 1st VWAP deviation (the grey line). Then wait for a pullback to the grey line again. From there you go Long.
VWAP and its Deviations are slowly moving so you need to check them out from time to time.
What I want to see is that when the pullback to 1.5802 occurs, the 1st Deviation is still around our level.
If the 1st Deviation is around this 1.5802 area, then it will be another (3rd) signal to add strength to our Support.
BTW if you would like to learn more about VWAP, then you may want to check out this webinar recording:
WEBINAR: VWAP Trading Strategies
EUR/AUD; 60 Minute chart:
I hope you guys liked my analysis! Let me know what you think in the comments below!
Happy trading,
-Dale
