Hello guys,
in today’s day trading analysis, I would like to focus on EUR/CAD.
There has been a pretty interesting development yesterday.
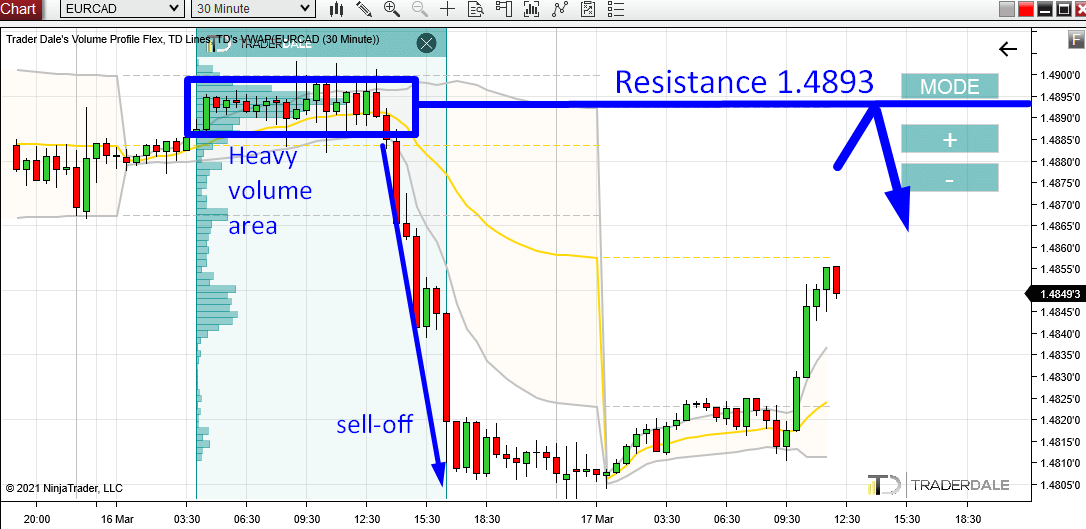
First, there was a rotation in which heavy volumes were accumulated. You can see those volumes nicely with my Flexible Volume Profile tool.
From this rotation, a strong sell-off started. This tells us, that there were strong institutional sellers building up their Short positions in this rotation.
Those sellers were entering their Shorts there, and then they pushed the price downwards. They placed most of their volumes around 1.4893 – this is where the Volume Profile is the thickest.
This area is important for them, because they placed most of their shorts there. For this reason they will most likely want to defend it when the price comes back in this 1.4893 area again.
This is why I think the zone around 1.4893 will work as a Resistance. Sellers defending this zone should push the price downwards from there again.
EUR/CAD, 30 Minute chart:

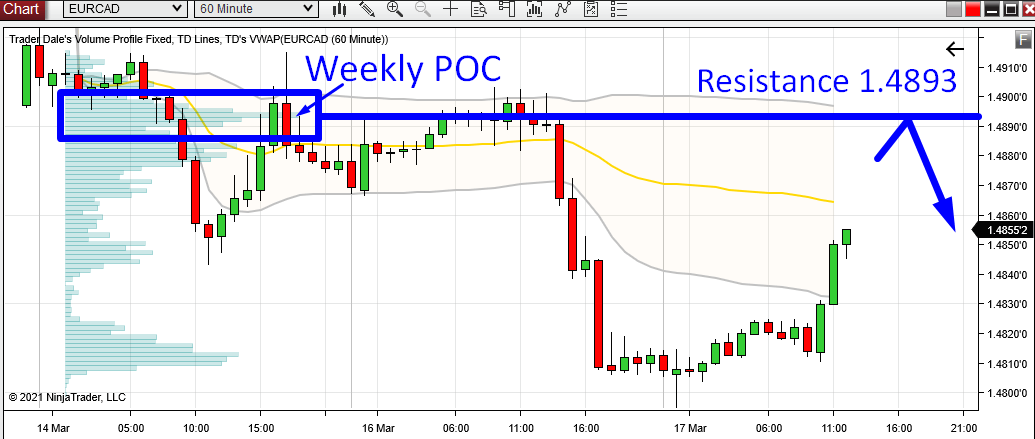
Weekly POC
This 1.4893 area is also significant, because it is the Weekly Point Of Control (POC). this means that the heaviest volumes throughout this week were traded at 1.4893.
When there is a Weekly POC from which a strong trend activity starts, then it usually represents a strong area just by itself. Just like in this case.
EUR/CAD, 60 Minute chart with Weekly Volume Profile:

1st Deviation of VWAP
Another nice addition to all this is VWAP.
Its first Deviation (the grey line) is now almost exactly at 1.4893 – our Resistance.
This 1st Deviation should work as a Resistance just by itself. If you combine it with Volume Profile setups (like we did here) then you will have very nice two-setup combos. Such combos give very nice trading opportunities!
If you would like to learn more about VWAP trading setups you may want to check this webinar recording:


Hello Dale,
Thank you for this cool examples of your strategy.
I will follow this on my demo account.
Hope, your hint will reach the assumed target
My pleasure Manfred, thanks for your comment!