Hello guys,
in today’s day trading analysis I would like to focus on EUR/AUD. There are some nice confluences of trading setups there. Let me start with Volume Profile analysis.
Volume Profile Analysis
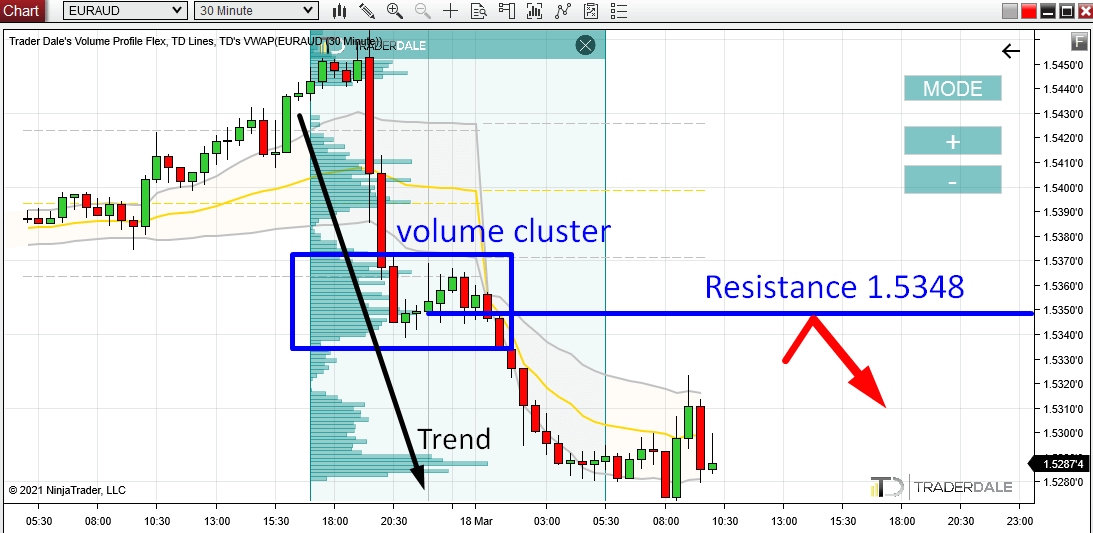
Yesterday, there was a trend on EUR/AUD. Within this trend, there was an area where heavy volumes got traded. This area is around 1.5348. The easiest way to discover those volumes was simply to use my Flexible Volume Profile over the trend area. Simple as that.
When there is such a heavy volume area created within a trend, then I call this place a “Volume Cluster”. A Volume Cluster created within a downtrend indicates, that sellers were pushing the price downwards, and then they were adding to their Short positions around the place where the Volume Cluster got created. In this case around 1.5348.
This area will be important also in the future, because they placed a lot of their Short positions there. They won’t let the price go past this zone without a fight!
This is why I think the price should react to this zone in the future and that it should work as a Resistance.
This volume-based setup is called the “Trend Setup“.
EUR/AUD, 30 Minute chart with Volume Profile indicator:

Support → Resistance
There is more to it to this Resistance though!
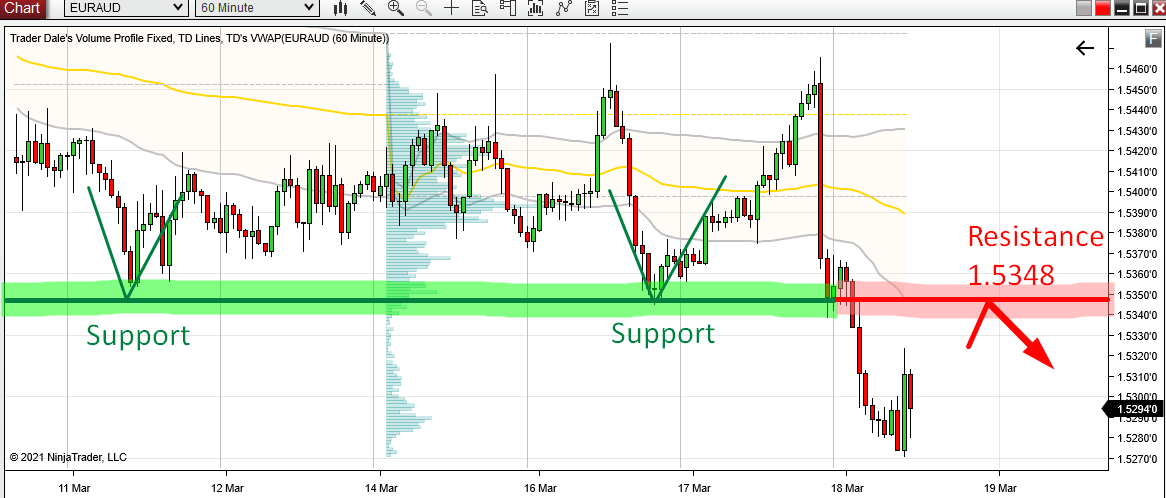
If you zoom out the chart a bit to see more history, then you will notice that the price very nicely reacted to our 1.5348 zone in the past! There were two very nice reactions.
Those reactions tell us, that this zone was a strong Support in the past. After the Support got breached (in today’s Asian session) it turned into a new Resistance.
Yes – a Resistance exactly in our 1.5348 area where the “Volume Cluster” was.
Nice confluence right?
You can learn more about this setup for example in this article:
Price Action Setup: Support→Resistance
EUR/AUD; 60 Minute chart:

Don’t forget the VWAP!
In my day trading analysis I also like to use Weekly VWAP indicator.
It it useful in many ways – you can learn more for example in this VWAP Webinar:
VWAP Trading Strategies (WEBINAR RECORDING)
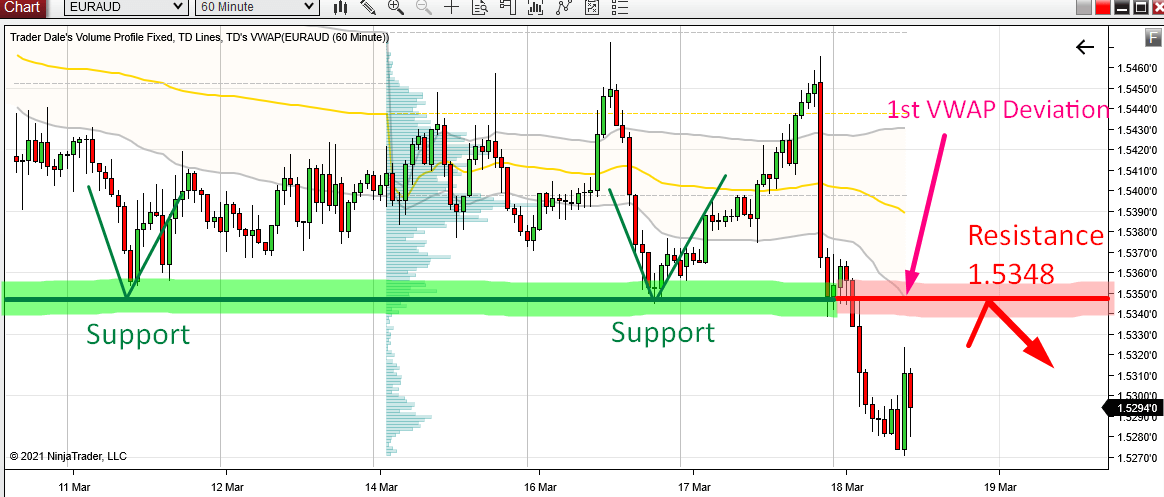
In this case, there is a setup called “VWAP Trend Setup“. With this setup you want to see the price move below 1st VWAP Deviation (that’s the Grey line) and make a pullback to it. Then the price should bounce off the 1st Deviation – it should work as a Resistance.
In our case, the 1st Deviation is exactly in the 1.5348 area and the price is moving below it. It seems that everything is ready for this setup to play out. Now we only need to wait for the pullback!
EUR/AUD; 60 Minute chart, VWAP indicator

Summary
In this analysis, I used three independent trading setups which all aligned together to point to a new Resistance around 1.5348
Those setups were:
So, this is how I like to do it. The more confluences I can find, the better!
Be careful though, even the best looking trades can fail. For this reason you should strictly follow your money management plan and don’t risk too much on one single trade.
I hope you guys liked today’s analysis. Let me know your thoughts in the comments below!
Happy trading!
-Dale
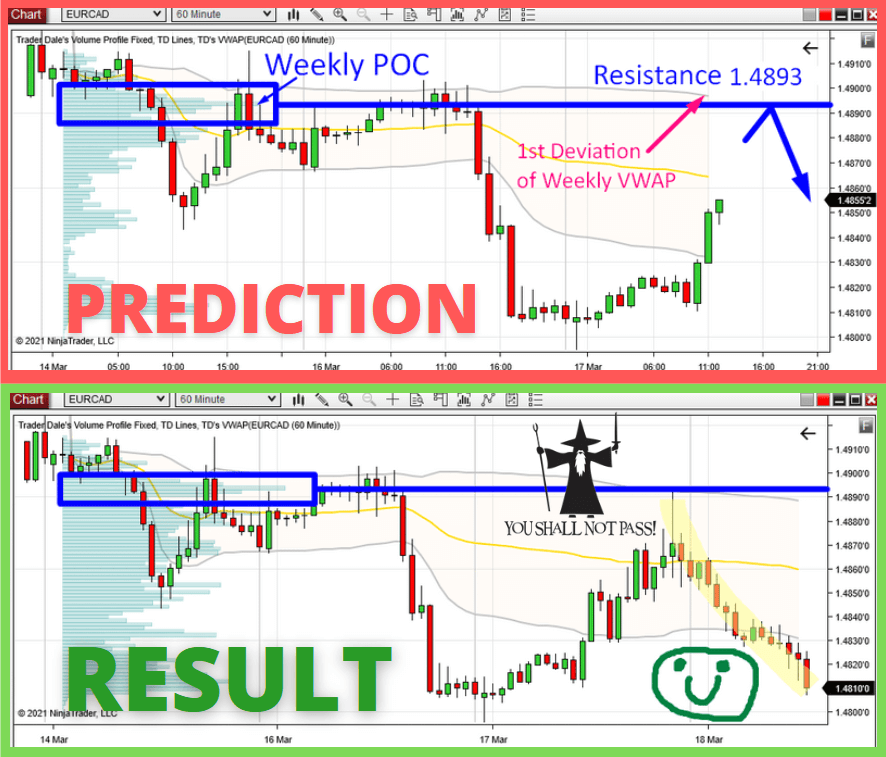
P.S. here is a Prediction from my yesterday’s market analysis on EUR/CAD and the Result:


Fantastic logic. Brilliant science. Pure art.