
Hello guys,
as soon as I opened the EUR/GBP chart this morning, I knew that this was it! There is a very nice day trading scenario that caught my eye at the first glance!
So, what is it all about?
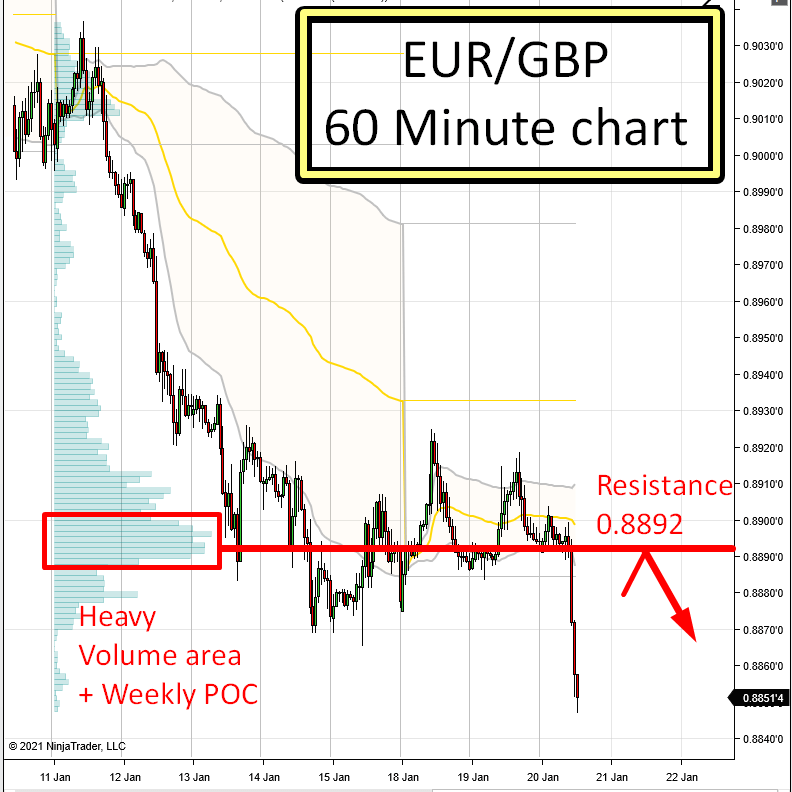
Let’s talk about Price Action First. There was a strong sell-off today morning (start of the EU session). This sell-off started from an area that was more or less a rotation.
If you have been following me for a while, then you know that I am super interested in places like these – rotation followed by a trend. That’s what I like to look for.
Volume Profile Analysis
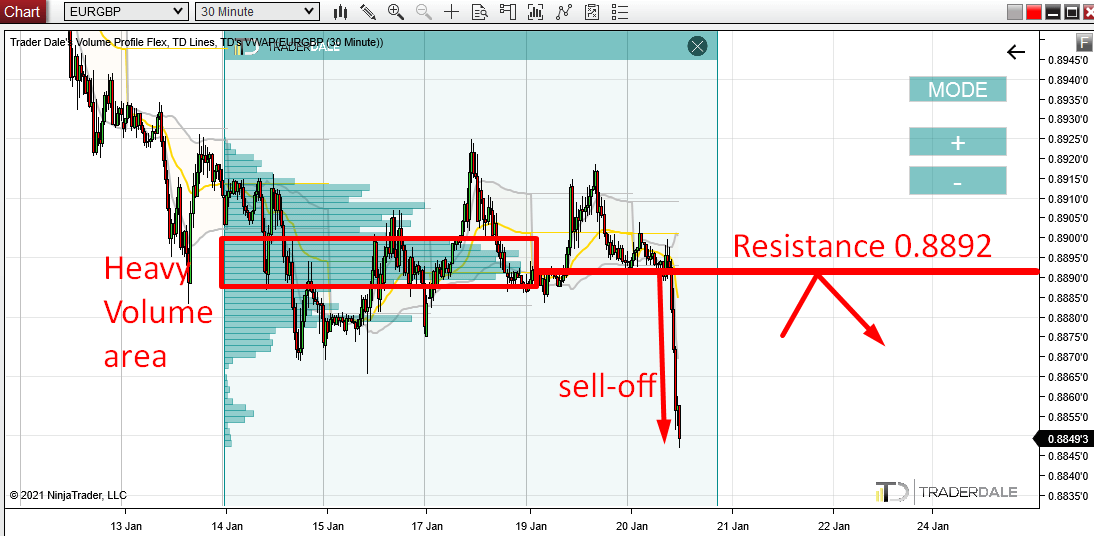
Why is that? Because in a rotation heavy volumes usually get accumulated. Then the trend shows you who was secretly accumulating their positions.
I call this the Volume Accumulation Setup
If the rotation is followed by a sell-off (like in this case), then it means that strong institutional sellers were slowly entering their Short positions there.
They accumulated their Shorts in the rotation and then they aggressively pushed the price downwards in the rapid sell-off.
How does this help us?
This gives us important information – now we know where a zone with strong sellers is. A zone that is very important to them.
When the price makes it back to this zone, then the sellers are likely to defend it and push the price downwards from it again.
This is what makes it a strong Resistance.
Check it out on the picture below (EUR/GBP, 30 Minute chart):
Do you want ME to help YOU with your trading?
Weekly Volume Profile – The Bigger Picture
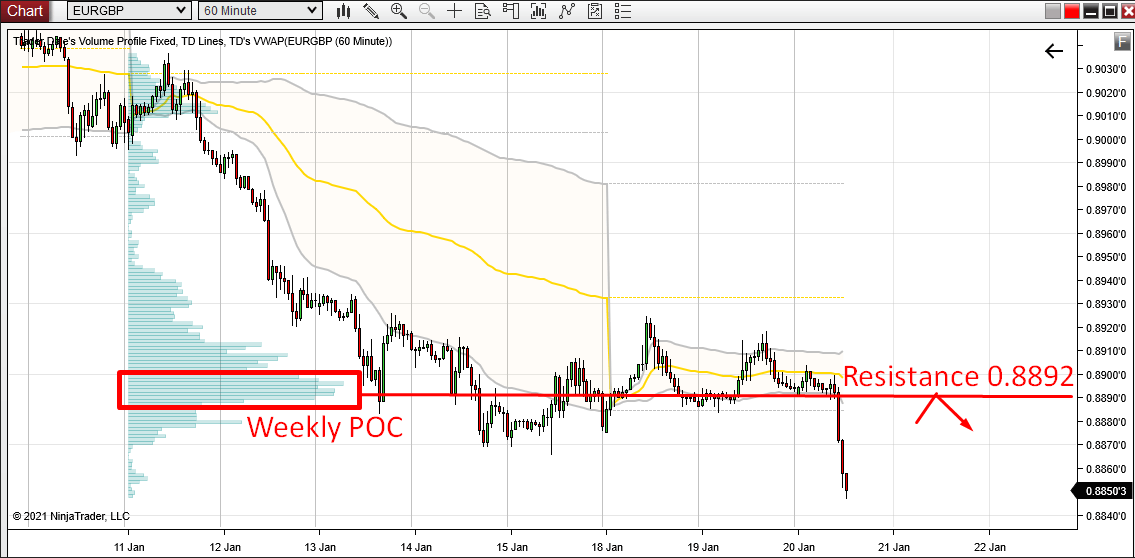
The next picture below shows the bigger overview. It is a 60 Minute chart of EUR/GBP with Weekly Volume Profile.
This Volume Profile shows how the volumes were distributed throughout the previous two weeks. It shows that the POC (Point Of Control) of this whole area was at our level.
This means, that the heaviest volumes in the last two weeks were traded around 0.8892. And from this place the sell-off started.
A strong selling activity commencing from a Weekly POC is a very strong trading level just on its own. I am always looking forward to trading these!
Check it out on the picture below, which shows EUR/GBP 60 Minute chart with Weekly Volume Profile:
I hope you guys liked today’s analysis! Let me know your thoughs in the comments below!
Happy trading!
-Dale
P.S. A very similar scenario and trade setup was used in my yesterday’s post. You can check it out here:
It was very Educational as well
Hey Kolisang, lets link up on facebook since we are from the same country so we can share ideas, im Desmond Dee on facebook
Thank you! 🙂
Hey Kolisang, lets link up on facebook since we are from the same country so we can share ideas, im Desmond Dee on facebook
do you recommend to use half position for GBP pairs?
I personally don’t trade those pairs as they are very wild. Only exception is EUR/GBP which on the other hand is pretty calm. Also GBP/USD is quite okay, but still a bit wild 🙂
Hit SL, sad 🙁
that’s a part of trading!
Sl due to the red news
That’s why we avoid trading during red news. 🙂