
Hello guys,
in today’s analysis, I will talk about a strong day trading resistance on EUR/USD. It is a resistance which I published yesterday for members of my trading course.
EUR/USD was under a really strong selling pressure yesterday. The pair dropped over 50 pips in a pretty short time.
When there is a sell-off like this I am always curious how volumes were distributed in that sell-off area as well as in the rotation that formed before the sell-off.
Volume Profile analysis
For this, I use my Flexible Volume Profile tool which allows me to look into any specific area in the chart.
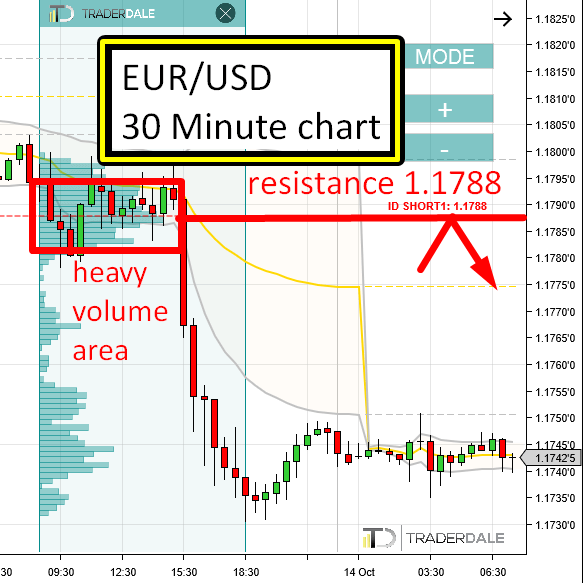
In this case, it shows that heavy volumes got traded in the rotation before the sell-off.
The heaviest volumes in this rotation area were at 1.1788 (this is the Point Of Control of this area).
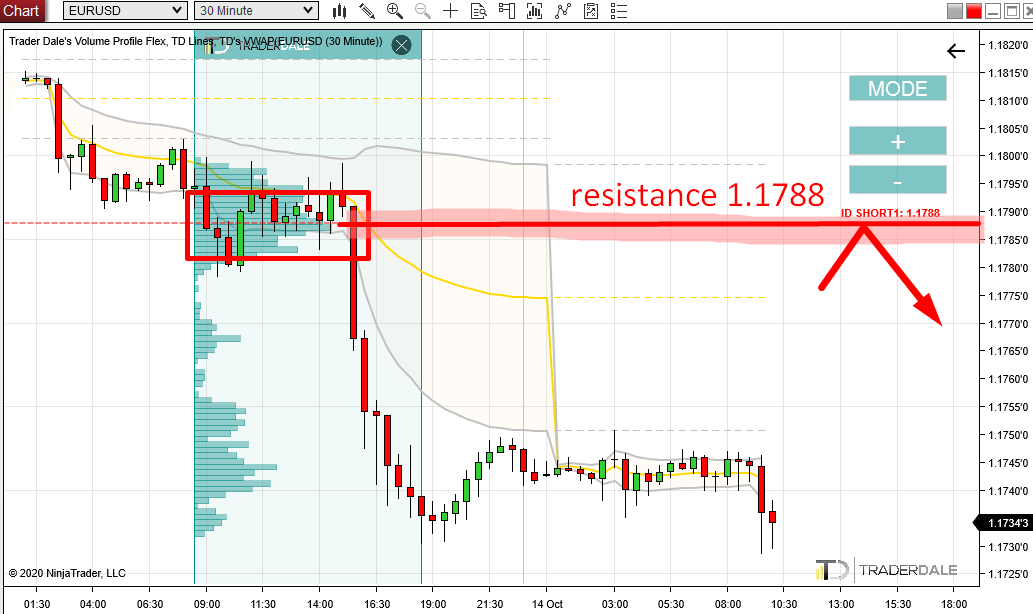
What I believe happened there was that sellers were building up their short positions there (in that rotation area) and then they pushed the price downwards into the sell-off.
What happens when the price makes it back into this area again? It is very likely that those sellers would want to defend their short positions. This zone around 1.1788 is important to them!
So, they will start aggressive selling activity (using Market orders). With this aggressive selling, they will want to push the price downwards again. Ideally with a snowball effect (other market participants join in and start selling as well).
This is why I think the area around 1.1788 will work as a strong resistance.
This trading setup is called the “Volume Accumulation Setup” and you can learn more about it for example in this webinar:
WEBINAR: Volume Profile Trading Strategies
EUR/USD, 30 Minute chart:
Do you want ME to help YOU with your trading?
Price Action analysis
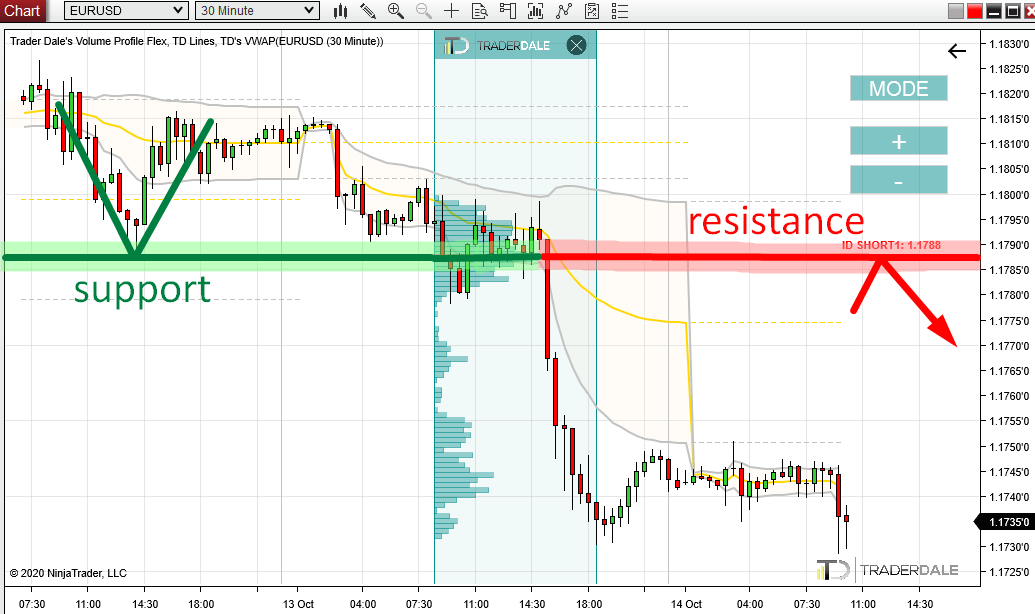
Another thing that speaks in the favor of the 1.1788 resistance is a setup which I call the “Support becoming Resistance setup“.
As you can see on the chart below, the price already reacted to this 1.1788 level on Monday. The reaction was really nice and sharp. This means the level worked as a support.
But now, when the support got breached it became a resistance.
The sellers who pushed the price through this former support will now defend it and won’t let the price go above it.
This is another reason why this 1.1788 resistance zone should hold.
EUR/USD, 30 Minute chart:

I hope you guys liked today’s analysis! Let me know what you think in the comments below.
Happy trading!
-Dale
I like your analysis. I tested it yesterday for the first time , it works very well on USD/CAD.
Thanks for the feedback, it works great everywhere. 🙂
Do you have the volume analysis tool available for METATRADER 5.
I would be interested in purchasing it.
I do have the tool for Metatrader 4 but my broker use Metatrader 5.
Kind Regards
Hi Stef, I do not have that. Everything I have is actually for Ninja Trader 8 platform, but the good part is that it can be used on its FREE version.
i am subscribed but did not receiving any signals analysis through email
Please check and verify the email I just sent you for the subscription. 🙂