in today’s day trading analysis I would like to show you how to trade the P – shaped profile on a nice example that has formed on EUR/AUD.
Price Action Analysis
If you look at the EUR/AUD (60 Minute chart) then you can see, that last week the price went down, then up, and then there was a rotation.
This tells us that the price tested the lower prices, but Buyers pushed the price upwards again – back into a rotation which is considered a current “Fair Value” area.
Fair Value – that’s where most of the trading takes place. Market participants consider the price to be fair there. At least for now.
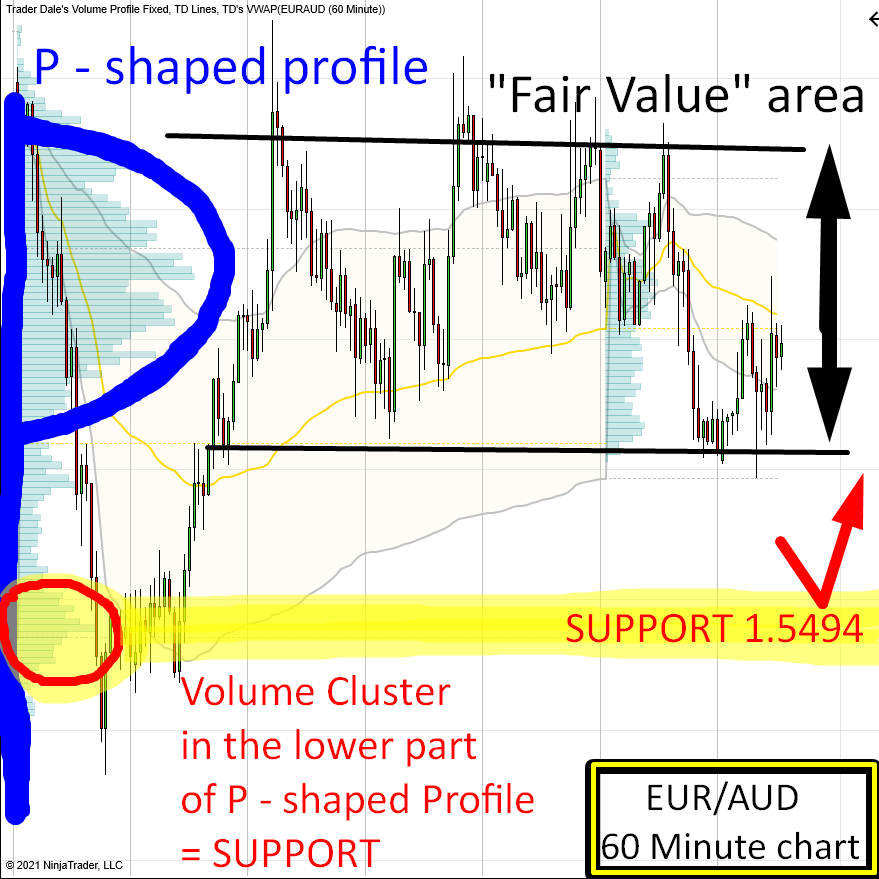
Volume Profile Analysis
If you look at the Weekly Volume Profile, then you can see that it is the thickest at the place where the rotation (Fair Value) was. This makes sense, because most trading took place there.
But, there is one more important place in the P – shaped profile. It is the little “bump” in the lower part of it.
This little “bump” is called a “Volume Cluster“. In this case, it points to a place where strong Buyers placed their aggressive (Market Orders) to turn the price upwards again. Back into the “Fair Value” area.
EUR/AUD; 60 Minute chart, Weekly Volume Profile:
Do you want ME to help YOU with your trading?
Learn my proven Volume Profile & Order Flow trading strategies! Get my proprietary indicators and start making progress. We even set the indicators up for you so you can hit the ground running TODAY!
Even though this Volume Cluster can’t match the volumes traded in the Fair Value area, it is really significant. The reason is that it points to a place where strong and aggressive Buyers were active.
When the price comes back into this area, then it is likely that those Buyers will become active again and that they will want to push the price upwards again.
EUR/AUD; 60 Minute chart, Weekly Volume Profile:
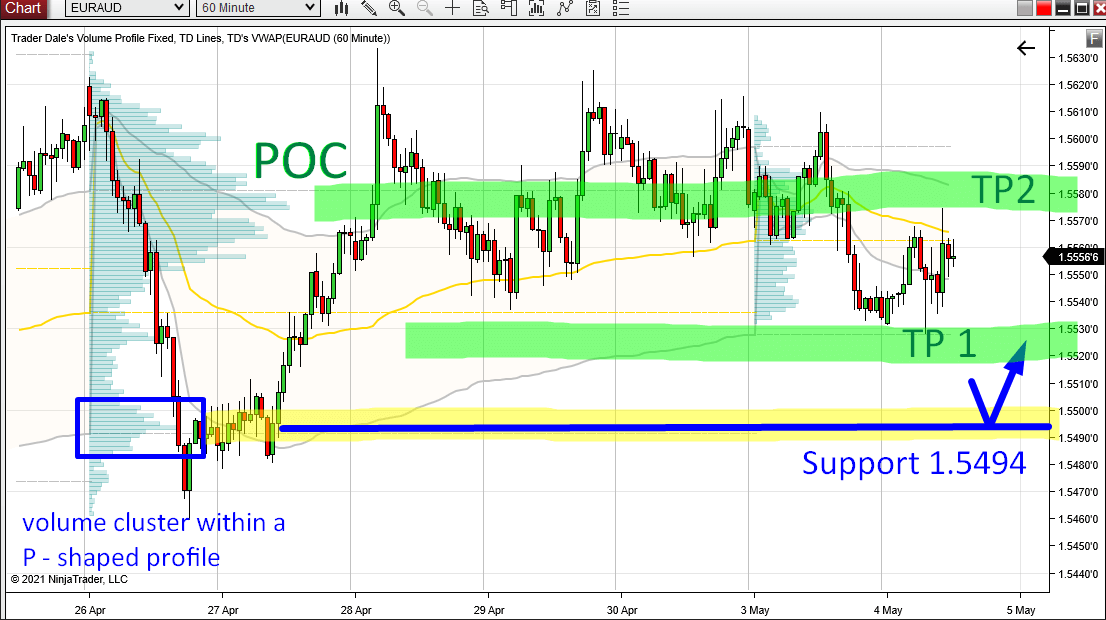
This is why this Volume Cluster represents a Support (around 1.5494). When the price makes it there at some point in the future, then I expect there will be a reaction to it.
How To Trade The P-Shaped Profile
The way to trade this would be to hold the Long trade from 1.5494 until it reaches the Fair Value area again. Ideally its Point Of Control (POC). In this case it’s at 1.5574.
This is a long way, right? So, what I prefer instead is to split the trade in two halves. Bank the first profit soon (30 pips max). And then secure your position by moving SL and trail the 2nd half towards the POC.
EUR/AUD; 60 Minute chart, Weekly Volume Profile:
I hope you guys liked today’s analysis! Let me know what you think in the comments below!
Happy trading,
-Dale
P.S. This is the result of the prediction:
7 thoughts on “How To Trade a P-Shaped Volume Profile (EUR/AUD Analysis)”
Spiros
Very interesting, kinda adds up many things you taught us into one trade…
Hello Prue, you should be able to subscribe to my mailing list on the banner which is all around the website.
If you won’t be able to find it just send me an email at contact@trader-dale.com please
I took that trade with full profit. But it’s happened by luck because there was unexpected news while im sleeping . That’s news was a cause of that spike .
Any way. Thanks Dale for your analysis 🙂


Very interesting, kinda adds up many things you taught us into one trade…
Thanks for your feedback Spiros, appreciate it! 🙂
Great, Dale. It is done in just one H1 candle on 6 May ’21!
thank you! 🙂
how could I receive your signal
Hello Prue, you should be able to subscribe to my mailing list on the banner which is all around the website.
If you won’t be able to find it just send me an email at contact@trader-dale.com please
I took that trade with full profit. But it’s happened by luck because there was unexpected news while im sleeping . That’s news was a cause of that spike .
Any way. Thanks Dale for your analysis 🙂