

Hello guys,
today’s day trading analysis will be on CHF/JPY!
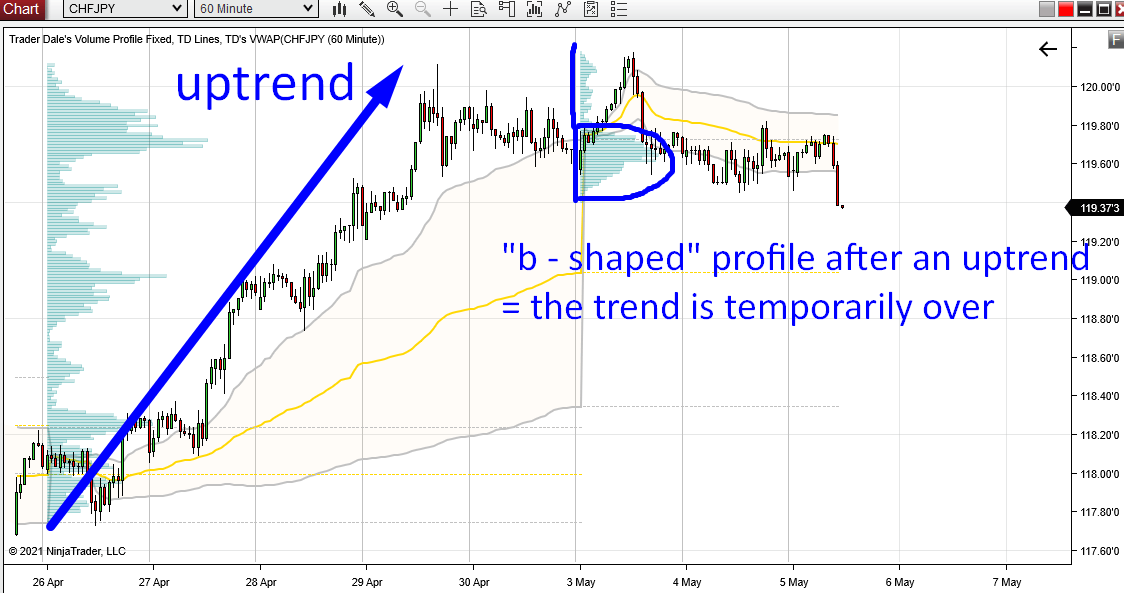
If you look only at Price Action, then you can see that there was an uptrend the whole previous week.
Now, it seems that the uptrend is at least temporarily over. How can you tell? If you look at the Weekly Volume Profile, then you can see that this week’s profile has a shape of a letter “b”.
“b-shaped” Volume Profile
The “b-shaped” profile tells us, that Sellers rejected the higher prices and that the “fair value” is not rising anymore.
If you see the “b-shaped” profile after an uptrend, then it tells you that the uptrend is over. At least temporarily.
Check it out in the picture below.
CHF/JPY; 60 Minute chart with Weekly Volume Profile:
Do you want ME to help YOU with your trading?
Volume Profile: Trend Setup
The trend may be over, but the strong Buyers who were driving this uptrend upwards and adding to their Longs there are probably not completely gone!
They will want to defend the areas where they placed the most of their Longs.
Such areas are called the “Volume Clusters”. You can see them on the Volume Profile from the previous week – when the price was in a Trend.
In those Volume Clusters (those little bumps on the profile) Buyers were adding to their Longs when they were pushing the price upwards. Those are the most important places in the uptrend, because heavy institutional trading activity took place in there.
When the price makes it back to those Volume Clusters then it is likely that those institutional Buyers will want to defend those areas – they have placed a lot of their trading positions there.
This is why those Volume Clusters should work as strong Supports.
CHF/JPY; 60 Minute chart with Weekly Volume Profile:
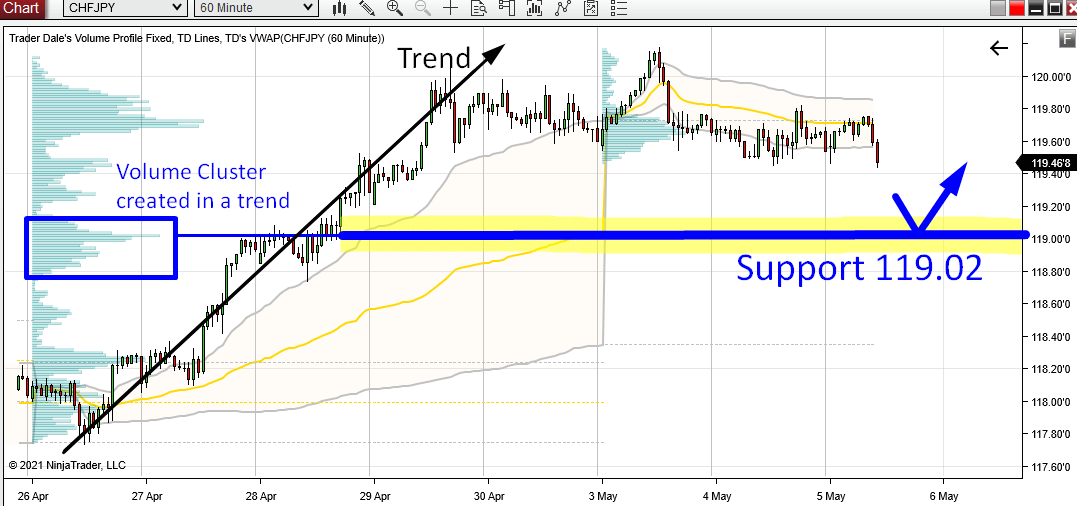
The closest strong Volume Cluster on CHF/JPY (that hasn’t been tested yet) is around 119.02. When the price comes to this area again, I expect the Buyers to defend it and to push the price upwards from there again = it should work as a strong Support.
I call this setup the “Trend Setup“.
I hope you guys liked today’s analysis! Let me know what you think in the comments below!
Happy trading,
-Dale

Always very sound analysis Dale, many thanks.
Thank you Trevor, appreciate it!
Great analysis but is it a sell order or buy order.
Please does your site supports trading view over the various currencies pairs?
Hi Elvis, I called support on this one, so it’s a ”buy” once the price reaches there. I still wouldn’t advise just blindly buying because I said so, it’s a lot of factors to consider and not all played out yet.
You can use my methods on absolutely any platform, but my tools are designed specifically for Ninja Trader 8.
Cheers!
Hi Dale how’s it going? Y’know, according to my understanding of the methods you teach, the only reasons for not taking the trade are because of macro news or because the level gets tested. Am I missing anything?
I guess what I’m really after is information on why levels are NOT traded, why levels get abandoned.
Anyways, thanks for the article; highly informative as always.
Hello, never better! Thanks for asking! Yea macro or level is tested. Also, I often abandon intraday levels that are older than roughly one month. Those are the only reasons I abandon level.
Cheers!
After about a month? Cool, thanks. Now I’m off to peruse my charts to see if my results are better if I delete old levels. ‘See you in about a month (back testing sucks). Thanks again for the tip.
My pleasure!