
Hello guys,
before I go into today’s analysis I would like to invite you to a special webinar that I am going to have next week on Thursday (12th). The topic of the webinar is going to be “Long-Term Investing With Volume Profile“.
I am super excited about it and I hope you will join me there! Please register your FREE seat using this link:
In today’s analysis, I will show you something similar as I am going to be talking about in the webinar.
I will show you how to use Volume Profile to identify the best trade entries for long-term investments. In this case, I will discuss the stock of the US company NIKE.
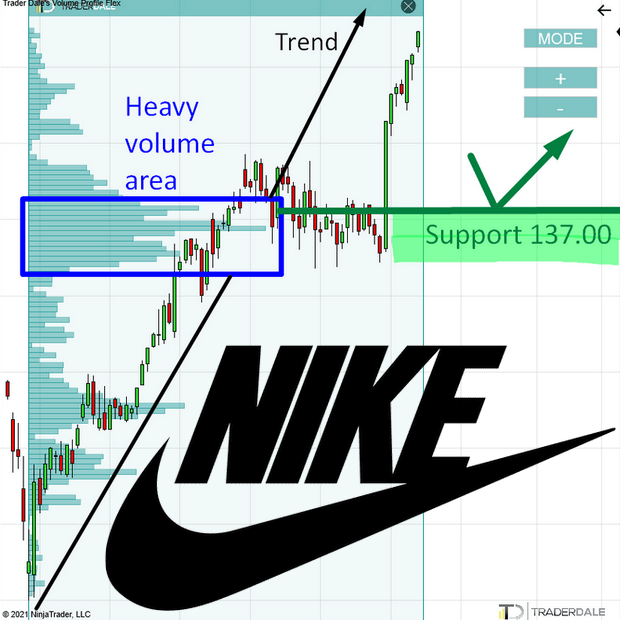
NIKE – Volume Profile Analysis
As many US companies NIKE is in the uptrend. One of the big reasons so many US companies are in an uptrend is that the FED is pumping free money into the US economy and this helps stocks to shoot higher and higher.
I am not a huge fan of buying a stock when it is at its all-time highs. What I prefer, is to wait for a pullback and then jump in.
A pullback to where? To heavy volume area.
The reason heavy volume areas are so important in an uptrend is that they work as strong Supports.
What they represent are places where the BIG trading institutions were adding massively to their Long positions.
NIKE, Weekly chart:
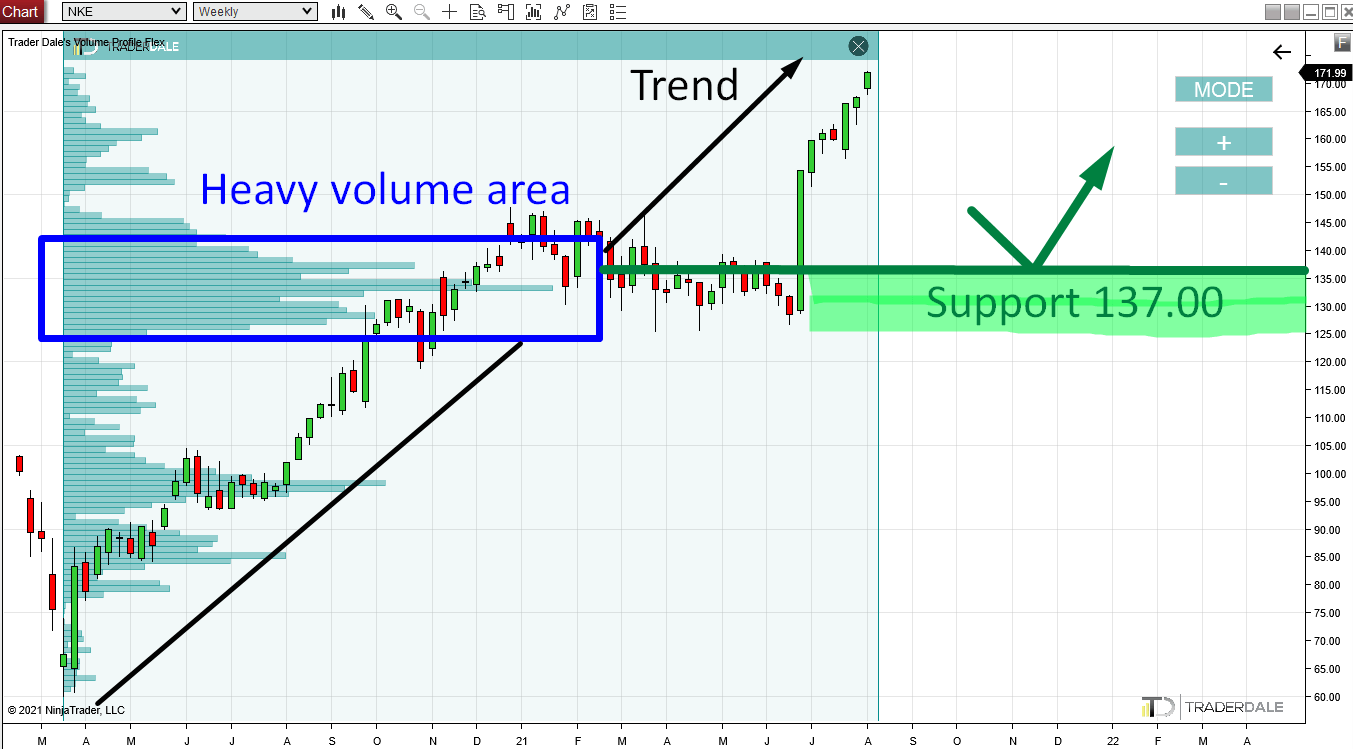
When the price makes a pullback into such heavy volume area, then those BIG trading institutions will want to defend such zone.
Why Are Heavy Volume Areas Important?
Those areas are important for them. The reason is they placed a lot of volumes there. If the price drops below such heavy volume area, then their Long positions will go to red numbers. They obviously don’t want that. They want to make money on their stocks and they need them to go higher and higher.
So, what those BIG guys do is they defend such heavy volume areas. They also use them to add some more to their Longs as those places are places with huge liquidity.
All this makes the heavy volume areas strong Supports.
Heavy Volume Area On NIKE
Such a Support is also on NIKE. If you look at the chart (Weekly time frame) and use my Flexible Volume Profile there, then you should clearly see the strong volume area that formed there. This is our Support (starting around 137.00).
This is in my opinion the ideal place to jump in and participate in the uptrend.
Don’t enter at the all-time high. Wait for a discount 😉
The Volume Profile setup I used here is called the “Trend Setup“. That’s a setup I use when there is a trend.
I hope you guys liked my analysis! Let me know what you think in the comments below!
Happy trading,
-Dale
P.S. Don’t forget to register for the FREE webinar next week (Thursday 12th August). The topic will be “Long-Term Investing With Volume Profile”.
Register your seat here: https://bit.ly/374RvwJ
Dale,
I like the analysis. My only comment/question would be, how high would NKE have to go for you to loose interest? (i.e. if it goes to 200, a drop back to 137 is like 30% correction, and that big of a correction might tell us NKE isnt on a discount NKE is actually now a bad company)
Hello, thats a good question. I would not lose interest even if it went to 300. that level would still be strong. Nike going to 300 would not really give me any other info than the price got inflated.
Hello dale?
What broker you will be recommended for usa. I have both courses from you including your membership. So i was wondering if there any broker you recommend for us people for particularly forex trading
Hello Srijon,
You can use OANDA broker in US