
Hello guys,
today, we are going to have a closer look at the CAD/CHF.
This pair is in a downtrend now and for this reason, I am looking for Short trades that I want to trade from significant Resistances.
One such Resistance formed around 0.7260. That’s the one I want to talk about today.
Price Action
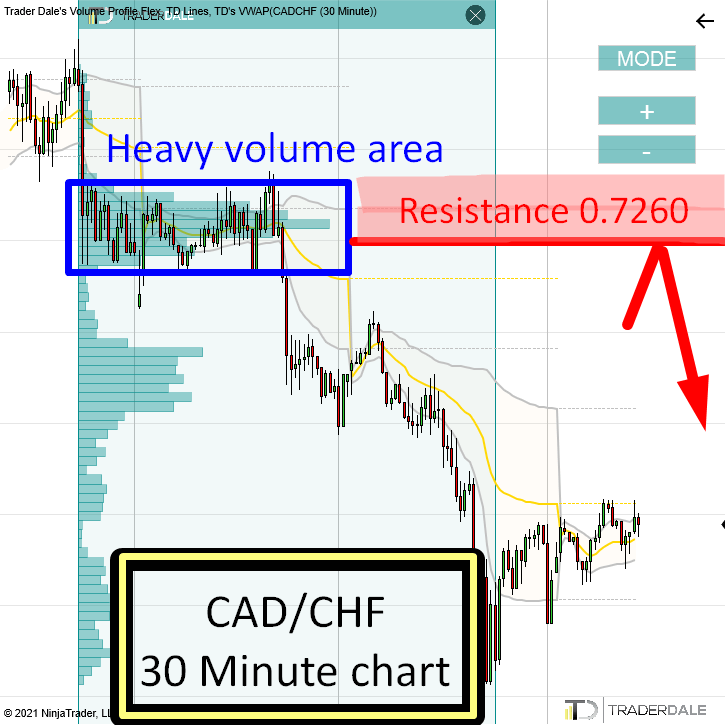
If you look at the picture below, then you can see that there was a rotation around this Resistance. There was a really tight price channel.
From this price channel, an aggressive sell-off started.
What this usually means is that strong institutional Sellers were building up their Short positions there (in this rotation). Or they were adding to their existing ones.
You can see those huge trading positions with my Volume Profile indicator.
CAD/CHF; 30 Minute chart:
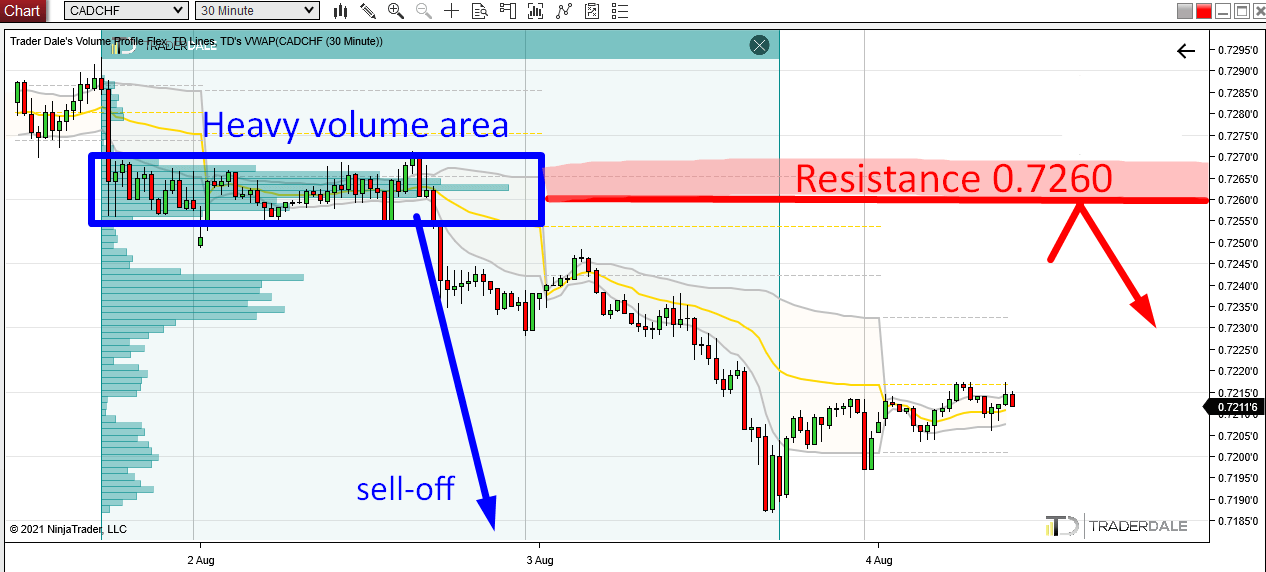
After the BIG guys were finished accumulating their Shorts they pushed the price downwards into a sell-off. It is the sell-off that confirms that those big volumes traded in the rotation were institutional Sellers.
When the price makes it back into this heavy volume area again, those institutional Sellers should start defending this place as it is clearly quite important for them. The reason I say this is that those guys placed a lot of their Short positions there. That’s why it’s important for them that this zone holds.
This makes this zone a strong Resistance.
So, when the price makes it back into this area again, those Sellers will want to defend it and push the price downwards from there again.
This Volume Profile Setup is called the “Volume Accumulation Setup”. You can learn all there is about it in my Trading Courses.
Do you want ME to help YOU with your trading?
Weekly POC (Point OF Control)
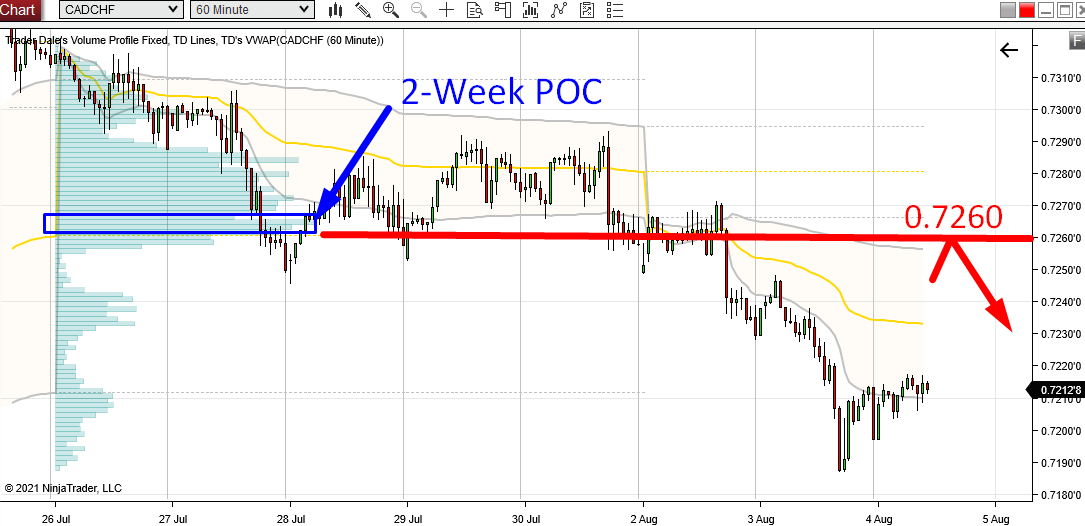
A nice addition to our 0.7260 Resistance is that this level is also significant from a higher perspective – from 1 hour chart with Weekly Volume Profile.
If you look at the picture below you can see that I merged two Weekly Volume Profiles – Volume Profile that shows all the volumes from the previous week plus Volume Profile that shows all volumes from the current week so far.
In those previous eight days, the heaviest volumes were traded around 0.7260 – yea that’s our Resistance! Our Resistance lies at two-week POC (Point Of Control)
This is why i say that the Resistance is also strong from the higher perspective.
The two week POC adds to its strength.
CAD/CHF; 60 Minute chart:
I hope you guys liked my analysis! Let me know what you think in the comments below!
Happy trading,
-Dale
P.S. I will be having a FREE webinar on Long-Term Investing With Volume Profile on Thursday the 12th August. Register your seat here:
WEBINAR REGISTRATION – Long-Term Investing With Volume Profile
See you there!
I can understand that Institutional traders can accumulate a position long or short over a shortish period of time at or around a particular price level, but what is the mechanism used to trigger a run or a sell off? Pushing the price in the direction they desire?
Hello,
they use market orders to make the price move. They also hope to start a snowball effect (more traders start to join in the trend).
This is good sir but can you also post the results of the analysis after the move .
Thanks.
Hello,
I usually do daily commentary on my levels in member’s area.