

Hello guys,
today’s day trading analysis will be on NZD/CHF.
There is a very nicely looking volume-based setup called the “Volume Accumulation Setup“
First, there was a rotation in which heavy volumes got accumulated (traded). You can see the volumes on the Flexible Volume Profile indicator below.
Then, after the big guys (trading institutions) placed their big trades there, they pushed the price upwards into an uptrend.
This uptrend tells us, that the volumes placed in the rotation (blue rectangle) were Longs.
This is an information we can work with. Now we know where strong institutional buyers placed a lot of their Long positions. It is around 0.6430.
This are is now very important place for them.
When the price makes it back to this heavy volume area again then, those buyers will want to protect it and to push the price upwards from there again.
Most likely from the place where they placed the most of their positions (0.6430).
NZD/CHF, 30 Minute chart:

The Bigger Picture – Weekly Volume Profile
Let’s now check the bigger picture and have a look at the Weekly Volume Profile.
The Weekly Volume Profile shows how volumes were distributed throughout the whole week. I always check this profile with all my intraday trades. The ideal scenario is when the trading levels I pick are nicely visible there.
The reason is that the Support/Resistance will not be important only for traders on the lower time frames, but also for traders who are trading higher time frames.
In this case, it couldn’t be better! Our 0.6430 Support lies exactly at Point Of Control (POC) of the week. This means that the heaviest volumes this week were traded there.
This makes the 0.6430 a very important. The Weekly POC is a very strong place to trade from, even if it was just on it’s own, without any other signals/confluences.
NZD/CHF, 60 Minute chart:

Price Action Setup
Another nice confluence is a setup called Resistance →Support.
In short, it says that when a Resistance gets breached it then becomes a Support.
This is one of my favorite Price Action Setups.
If you look at the picture below, you can see that the price bounced very strongly of the 0.6430 area in the past. This means it was a Resistance.
Then, as the Resistance got breached it then became a Support.
NZD/CHF, 60 Minute chart:

Summary
All in all we have three signals that confirm our 0.6430 Support. They are:
Do you want ME to help YOU with your trading?
Some Recent Trades
On Monday, I sent out a video with trading ideas for this week. In the video, I mentioned four trading levels. Two of them already got hit, so let’s check out how they went!
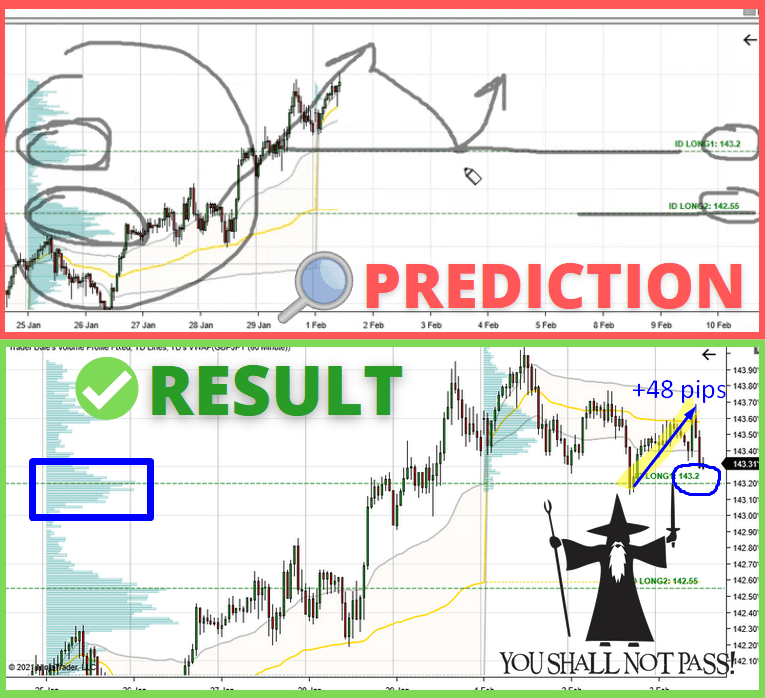
GBP/JPY, Support at 143.20
This trade was based on the Trend Setup and there was a +48 pip reaction to this Support yesterday:
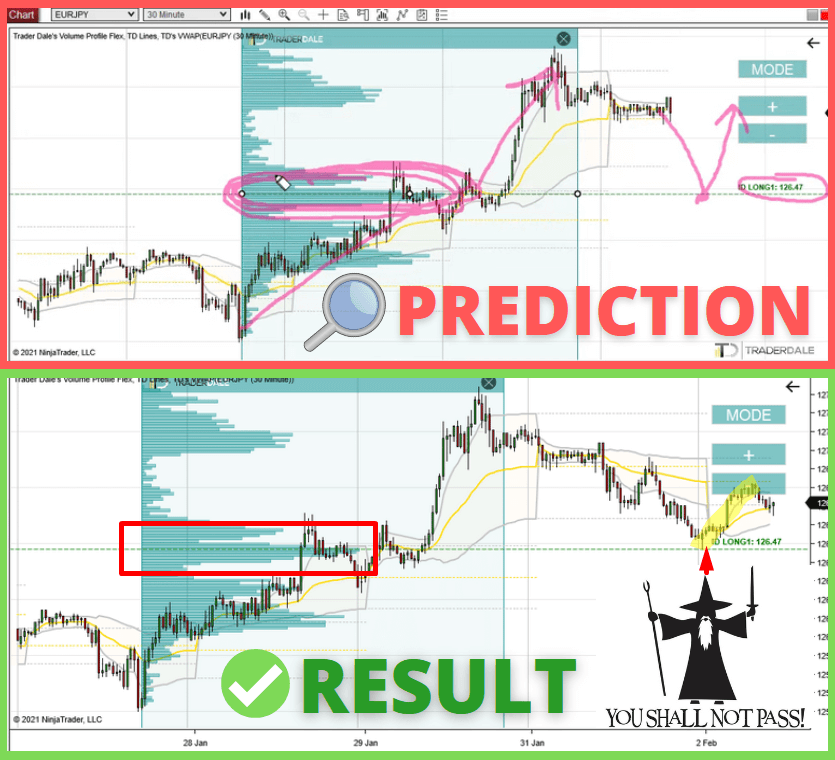
EUR/JPY, Support at 126.47
This trade was based on Volume Accumulation Setup and there was a very precise +35 pip reaction to it on Tuesday:
I post Weekly Trading Ideas videos and fresh Market Analysis articles regularly here:
I hope you guys liked today’s analysis. Let me know what you think in the comments below!
Happy trading!
-Dale

Thanks, Dale, Excellent content as per usual.