

Today, I will do a trade analysis of EUR/USD. This is one of the most important pairs right now as the US elections are over. Everybody is watching this one to predict how the currency markets will develop after Biden won the election. Why is EUR/USD the most important pair? Because the majority of all world currency transactions are done on EUR/USD.
In this analysis, I would like to focus on the big price movement which we saw on many trading pairs yestarday. On EUR/USD the movement was over 100 pips in just around 2 hours.
What happened before this movement? There was a rotation and in this rotation heavy volumes were accumulated. You can see this nicely when you use my Flexible Volume Profile indicator.
After the rotation there was a sharp rejection of higher prices and immediately after that, there was the sell-off.
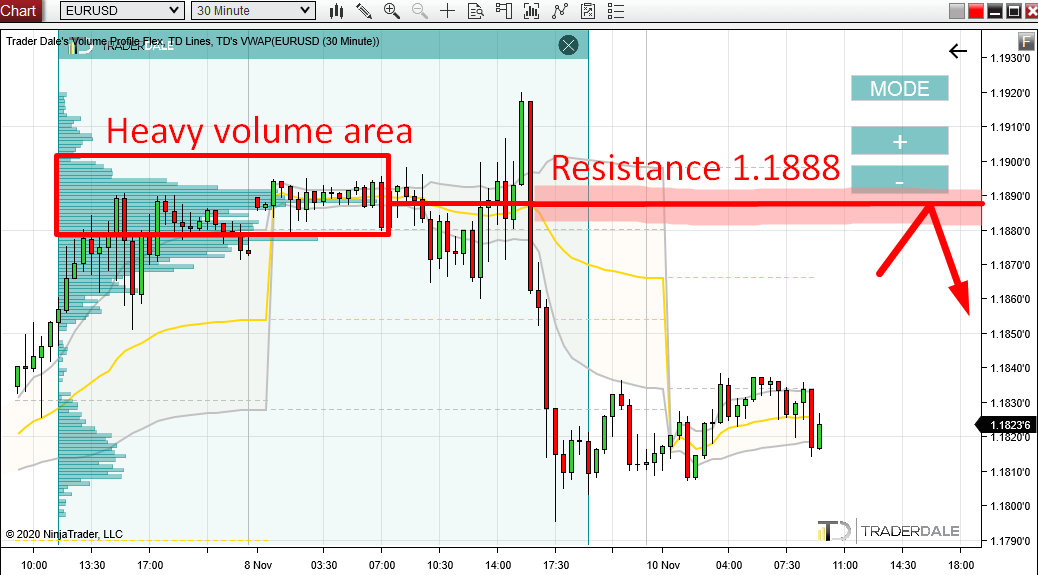
What I am interested in the most are the heavy volumes that were accumulated right before the sell-off started yesterday. I believe that those volumes were volumes of strong sellers (big trading institutions) who were building up their short positions there – in the rotation. After they had entered their shorts, they started to push the price aggressively downwards – to start the sell-off.
This information gives us an edge, because we now know where interests of strong sellers lie. They lie in the place where they placed most of their short positions. If you look at the Volume Profile in the picture above, you can see that the heaviest volumes were traded around 1.1888.
When the price makes it back to this level at some point in the future, then I expect that those strong sellers will want to defend this area. They will start aggressive selling and they will try to push the price downwards again. This is why I think the area around 1.1888 will work as a strong Resistance.
Do you want ME to help YOU with your trading?
Weekly Point Of Control (POC)
What I always like to see are confluences. In this case it is the Weekly POC right at the 1.1888 level.
If you merge Volume Profile from the previous week and this week, then it shows that the heaviest volumes traded in this period were exactly at 1.1888.
This information adds to the strength of the level because when the price hits this zone, it won’t be only intraday traders and scalpers trading it, but also institutional traders who focus on trading higher time frames.
Weekly Point Of Control on the most liquid trading pair is something they would never miss!

Stop Loss placement
The 1.1888 Resistance is based on a high volatility movement. It would be risky to use tight Stop Loss. In cases like this it is best to adjust your SL and TP to the volatility.
If you went short from the 1.1888 area, then in my opinion a good SL would be 30 pips. Take Profit at least 30 pips as well.
If you would like to learn where to place SL and TP, then you can do so in this webinar:

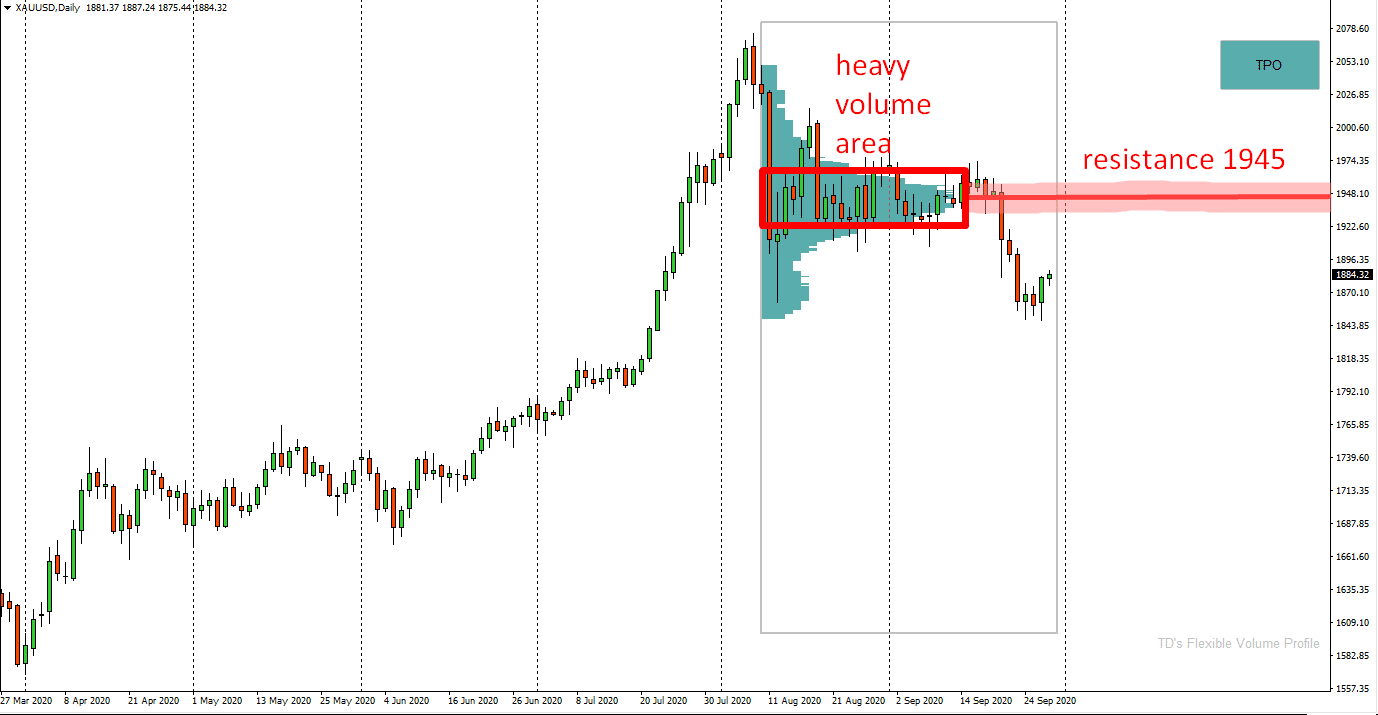
Gold
there is one more thing I wanted to show you in this article. It is the nice reaction to a volume-based Resistance on Gold.
I wrote about this Resistance over a month age in this article:
GOLD: The Most Important Institutional Supports and Resistances
Back then I predicted a strong swing trading resistance at 1945. This resistance was based on Volume Accumulation Setup (the same setup as today’s EUR/USD).
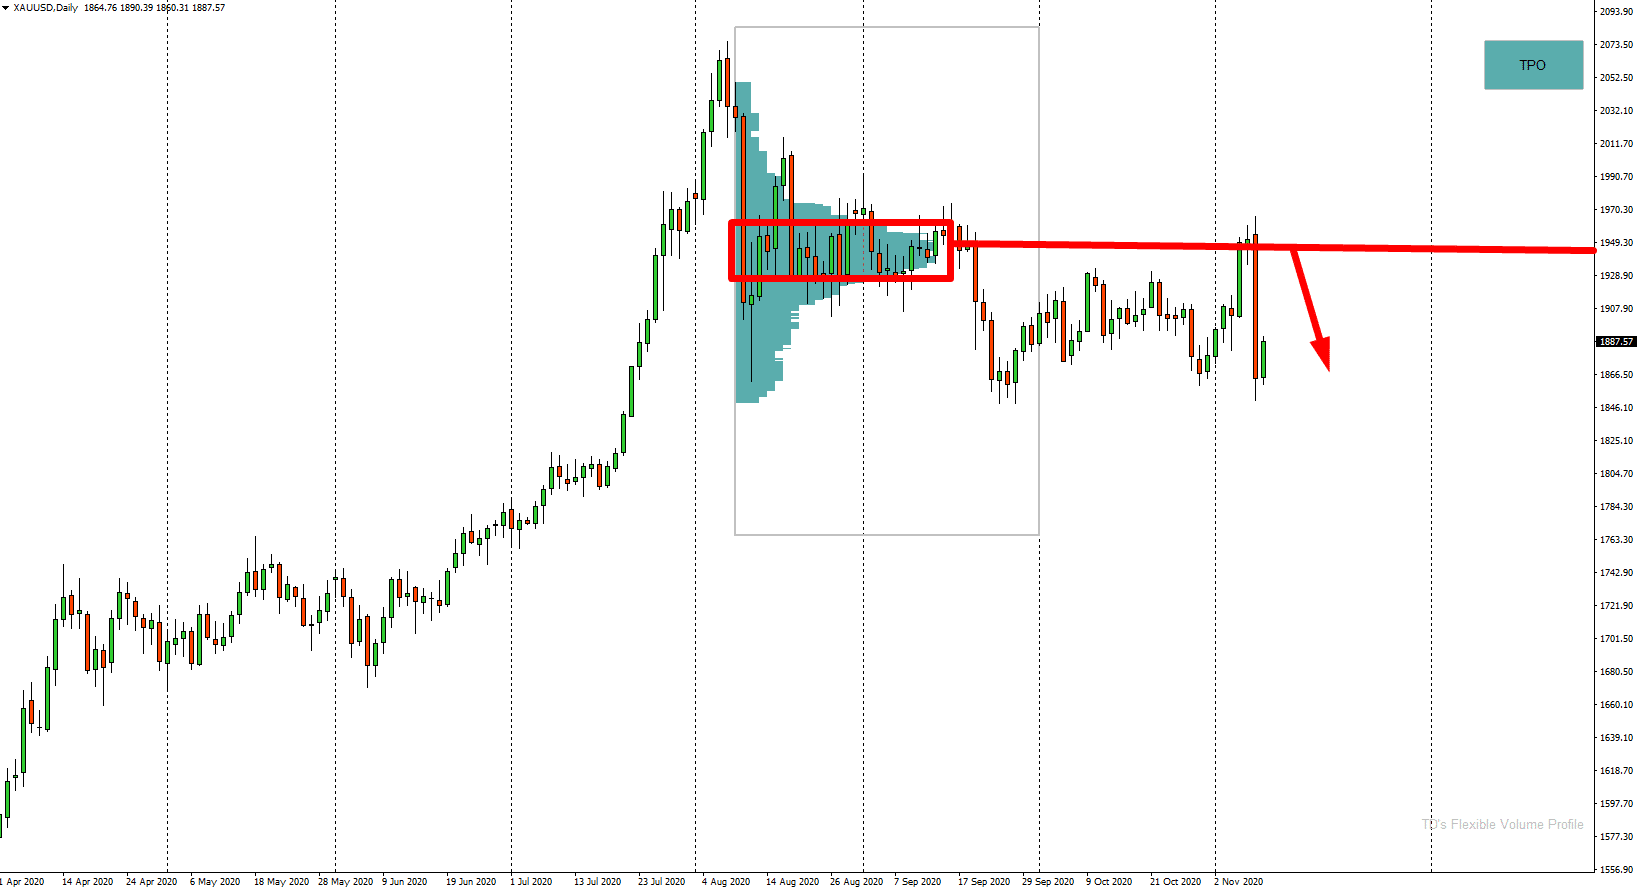
Yesterday, the price reacted to this level with a huge sell-off.
You can see the Prediction and the Result in the two pictures below:
Gold -PREDICTION from 29th September (Daily chart):
Gold – RESULT (Daily chart):
I hope you guys liked today’s analysis! Let me know what you think in the comments below!
Happy trading!
-Dale

Oh My!
I missed the GOLD Setup
No worries Adrian, opportunities are endless here, don’t stress about missing on one trade.