

In today’s Asian session there was significant macroeconomic news regarding the New Zealand Dollar. It was the “Official Cash Rate” and “RBNZ Monetary Policy Statement”.
As a reaction to this news, the NZD strengthened against all the other currency pairs. This created many nice trading opportunities.
Today I am going to talk about one of them. It is a newly formed day-trading Support on NZD/USD. Let’s have a look at it!
Volume Profile analysis
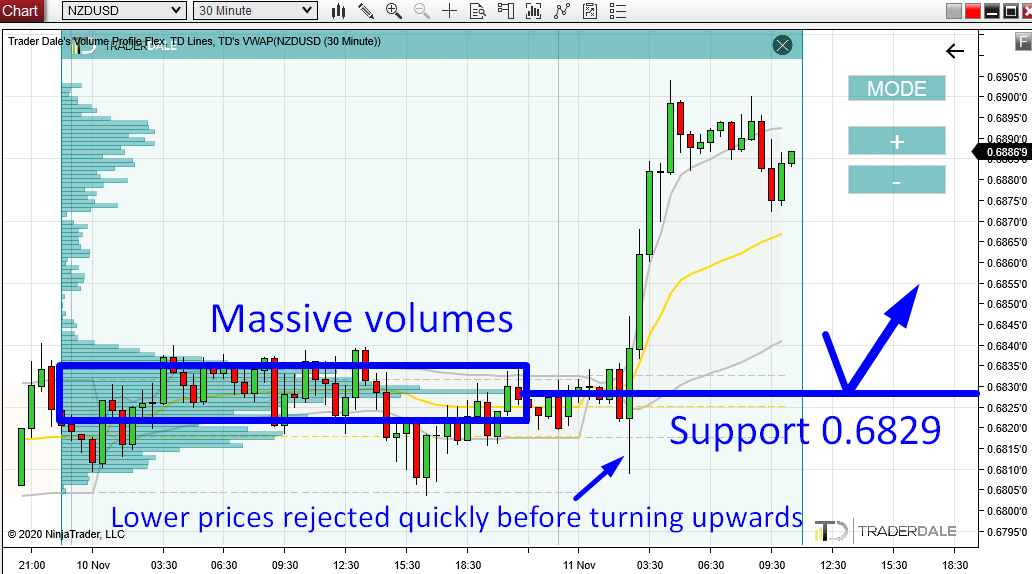
In the picture below, you can see that there was a long rotation from which a strong uptrend started. This is what all this is based on.
The reason is that in such a rotation, heavy volumes are usually traded. This means the big guys were entering their positions there. After they had finished, they forced the price to go into a trend.
My Flexible Volume Profile shows that there was a massive volume accumulation area, with the heaviest volume peak around 0.6829. This is the Point Of Control (POC) – a place where the heaviest volumes got accumulated.
From this POC, the price started to go aggressively upwards. This means that the big guys who accumulated their volumes there were interested mostly in building up their Long positions there.
When the price makes it back into this strong POC area again, then it is likely that it will make a reaction there and go upwards again – the 0.6829 will work as a Support.
Why? Because the big institutional players who accumulated their Longs in that rotation will want to defend this zone.
This setup is called the “Volume Accumulation Setup“.
NZD/USD, 30 Minute chart:
Do you want ME to help YOU with your trading?
Join one of my Volume Profile Educational courses and get my private trading levels, 15 hours of video content, my custom made Volume Profile indicators, and more!
Click Here
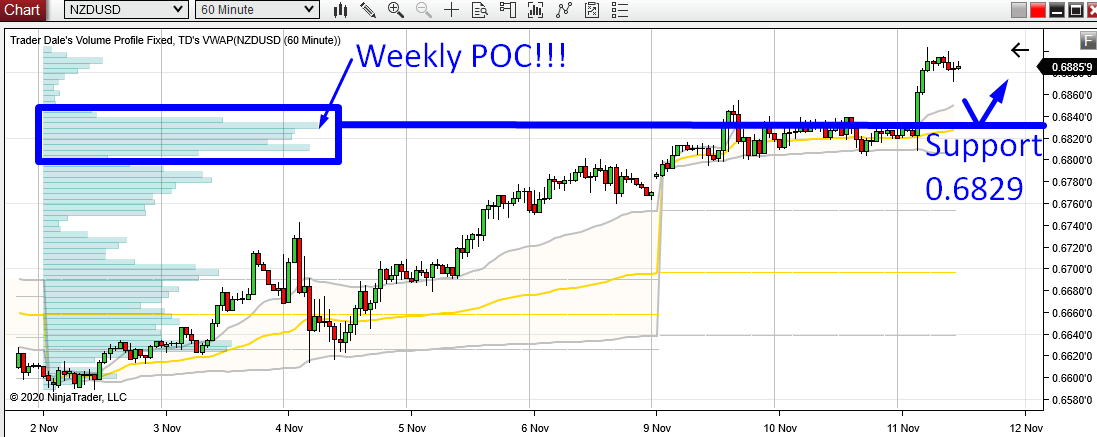
Weekly POC
Those who follow me or who enrolled in one of my Trading Courses know, that I like to look at higher time frames for confirmations.
I always look at my Weekly Volume Profile which shows me the big picture. The big picture is always very important!
In this case, I merged two Weekly Profiles – previous week and the current week. You can see this in the picture below.
The most important thing to notice here, is that the POC of this whole 2 week area is exactly at our 0.6829 Support!
This is really a strong confirmation. This level is strong not only for day-traders but also for traders who work and trade with higher time frames. They too will want to trade this!
NZD/USD, 60 Minute chart:
I hope you guys liked today’s analysis! Let me know what you think in the comments below!
Happy trading!
-Dale
PS. Yesterday, I did a similar analysis on EUR/USD. You can read it here:

Thanx alot Dale.
My pleasure Ahmed. 🙂
What king of SL would you recommend?
kind…
Did this trade get stopped out?
You can learn more about volume SL placement for example in this webinar I had: https://www.trader-dale.com/swing-trading-with-volume-profile-webinar-learn-to-trade/
SL, in this case, was below the rejection point (before the strong buying activity) at 0.6808. It was not hit – but it was close!
Wasn’t this a day trade idea where SL was 12 pips, which was hit?
In such a trade, where you have such a nice place for SL, I prefer to place it there (below the low).
In any case, no matter which approach you chose, the trade was a winner. If you traded 10/12 TP/SL then TP was hit (the initial reacton was 12 pips) The other alternative was to use 20/20 TP/SL which was also a winner.
Sorry but when exactly was your trade filled? The 10/12 TP/SL was a loser for me!
I took it with a bigger TP/SL, but the first touch was 11:51 p.m. (utc +1). From there the initial reaction was 12 pips.