
Hello guys,
in today’s day trading analysis I would like to show you my thought on NZD/USD.
On Friday, there was a strong macro news (NFP & Unemployment Rate in the US). Those are among the strongest macro news affecting the USD.
After the news was released, all the USD-related Forex pairs made a huge jump as the USD weakened all across the board.
One such strong move was also on NZD/USD.
The activity during the news is definitely important, but what is also important is what happened before.
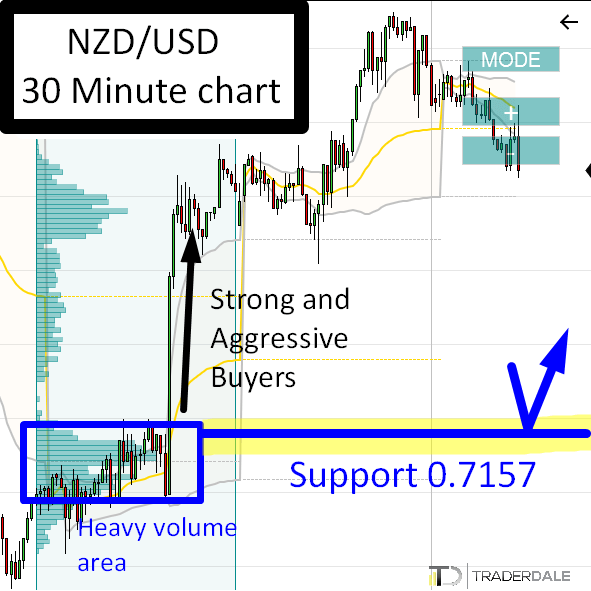
Price Action Analysis
Before the news release, there was a rotation. What happens in a rotation is that BIG trading institutions are entering their trades (slowly and unnoticed).
In this case, I expect that those were strong Buyers, because a strong uptrend started from that rotation (in the macro news).
In the picture below, you can see the rotation followed by the aggressive buying that caused the uptrend.
NZD/USD; 30 Minute chart
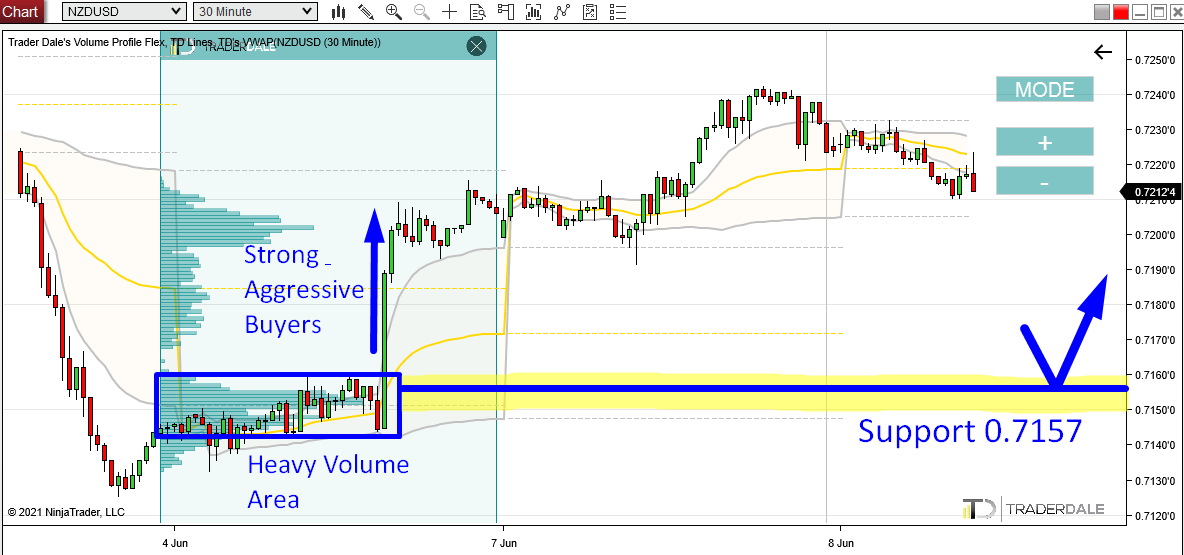
Now we know that there were strong Buyers, who entered their Longs in a rotation, and then pushed the price upwards into a strong uptrend.
Volume Profile Analysis
If you use my Volume Profile tool, then you can look inside this area and see how volumes were distributed there. Being able to see the volume distribution is very important because it will let you see where the BIG guys placed most of their trades.
The Volume Profile is the widest around 0.7153. This means they placed most of their trades there – which makes this area important.
When the price makes it back into this area again, then I expect that those strong Buyers will want to defend it. They will defend it by placing aggressive Buy Market Orders and they will use them to manipulate the price to go upwards.
Why defend it? Because this zone is important for them. They placed a lot of their trading positions there.
For this reason, I expect that this zone will work as a strong Support.
This Volume Profile setup I used is called the “Volume Accumulation Setup“.
Trade Adjustment
You have probably noticed from the picture above, that I have the Support a bit higher. Not at 0.7153, but at 0.7157. The reason is that my strategy currently seems to have better results when you enter the trades a bit earlier. It prevents situations when the price reacts to the level a bit sooner and makes the move without me being in it.
I hope you guys liked my analysis! Let me know what you think in the comments below!
Happy trading,
-Dale
Do you want ME to help YOU with your trading?
Join one of my Volume Profile Educational courses and get my private trading levels, 15 hours of video content, my custom made Volume Profile indicators, and more!
Click Here
Hi Dale,
This is a great example of a question I’ve been wanting to ask for ages
On NZDUSD chart above isn’t there a good rotation at 0.7202 as I have marked this for a possible long
The question is: When you have 2 rotations like on your chart roughly 50 pips apart causing a GAP between the 2 rotations are we saying that price will most likely fill the gap?
Hello,
7202 – I would want to see a stronger buying activity starting from there.
I would not say the price will most likely close the gap, nope.
Hello Dale,
Just curious, when the price does approach back to that 0. 7157 area of support, and you do decide to
go long there, what possible confirmation might you look for? I know you have discussed confluence before,
like vwap, look back price action where the support zone was once a resistance zone, but do you ever consider
a lower time frame ,say, like a 5 minute chart, to see if price was reacting at the 0.7157. Thank you
Mark
PS: Or what about order flow footprint chart
Hello,
with this pair and also with crosses I don’t do OF confirmations, but VWAP confirmation would be a plus! I don’t do any other confirmations, not even a price action confirmation. Sure, you can do it on 5 Minute chart, but you will miss a lot of good trades.