

Hello guys,
this is the second part of the Market vs. Limit Order article I wrote last week. If you missed it you can read it here:
Market Vs. Limit Orders – Which One To Use?
In today’s article, I am not going to tell you which type of order to use, because that was the main message of the previous one. Today, I will focus on another interesting phenomenon related to this topic – Stop Loss Hunting.
“My Broker Is Hunting My Stop Loss”
A typical thing beginner traders say: “My broker is hunting my SL, he knows exactly where it is and he always makes the price go exactly there.” Or “I am the most unlucky person ever – the price always hits my SL and then turns the way I predicted.”
Sure, having a reliable broker is crucial but in this case, it’s very often the fault of the beginner trader. Well, in fact this is not just beginners. Even advanced traders have such problems…
Let’s now talk about what is the reason of this “SL hunting” and let’s use a recent example.
Heavy Volume Zones On DAX
A couple of days ago I wrote an analysis on DAX. In this analysis, I showed a strong volume-based swing Support around 14.600.
As a reaction to this I received a couple of emails from people asking me why not the higher area, around 15.250? Both are heavy volume zones, so why not trade both?
Here are the two heavy volume zones on DAX, 4 Hour chart:
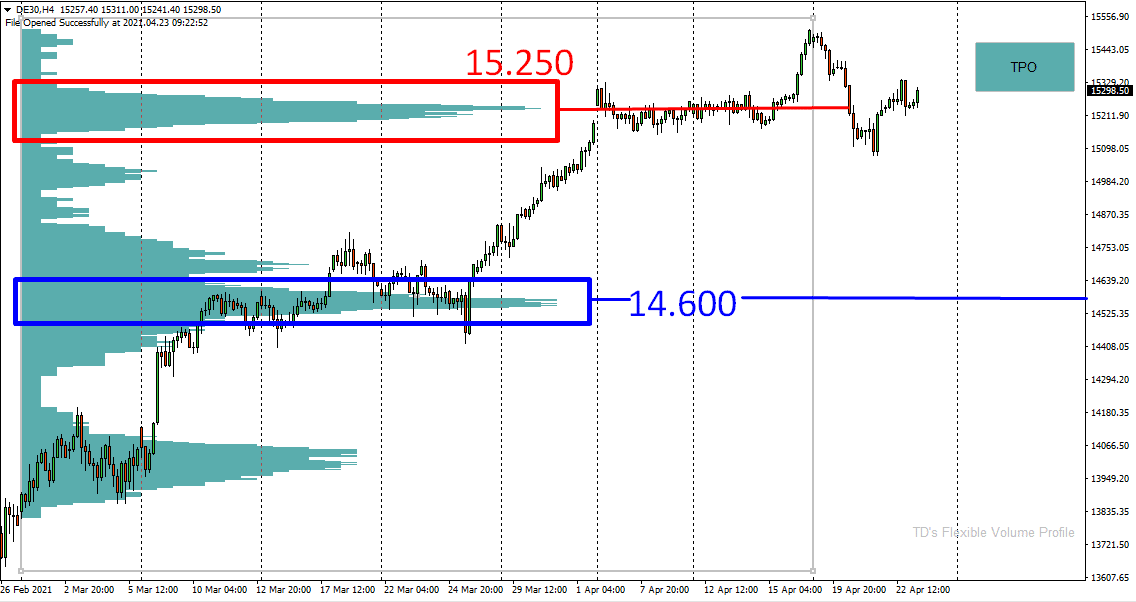
Lets talk about the 15.250 zone now.
Those heavy volumes you see there were accumulated in a rotation area around 15.250 (marked in red). That rotation area though, had a very “weak low“.
The Weak Low
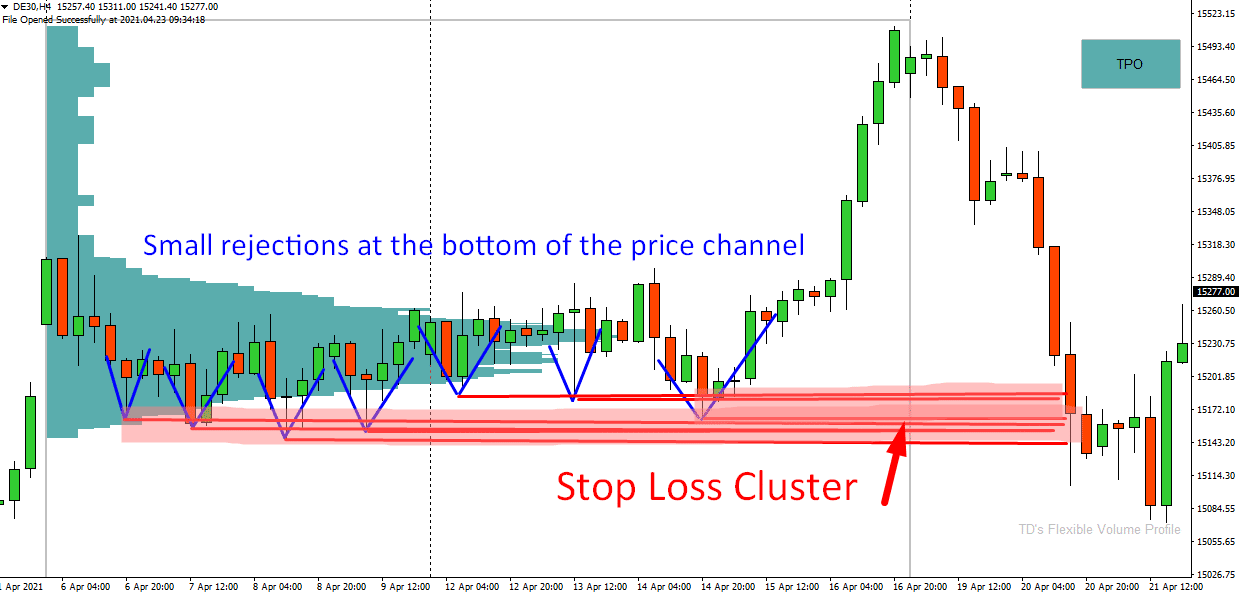
There were so many little reactions to the low of the price channel, but not a single big and strong rejection.
What many traders do is that they have their SL orders below the rotation channel. This is usually traders who trade breakout strategies, or traders who are trailing the trend.
The picture below shows this rotation zone more in detail and it shows all those small and weak rejections. Below such rejections, many people place their SL orders.
Do you want ME to help YOU with your trading?
I call the areas where people place a lot of their SL orders “SL Clusters“. What usually happens is that the price goes there and “consumes”all those SL orders there.
Who is doing this? Not the “evil broker”. It’s the BIG trading institutions who manipulate the price to go there. Then they take all that free liquidity there (liquidity from those SL orders). Big guys need liquidity. They need it to enter their trades. They actively manipulate the price and look for places with liquidity like the one I showed you.
BOOM! – Everybody Out!
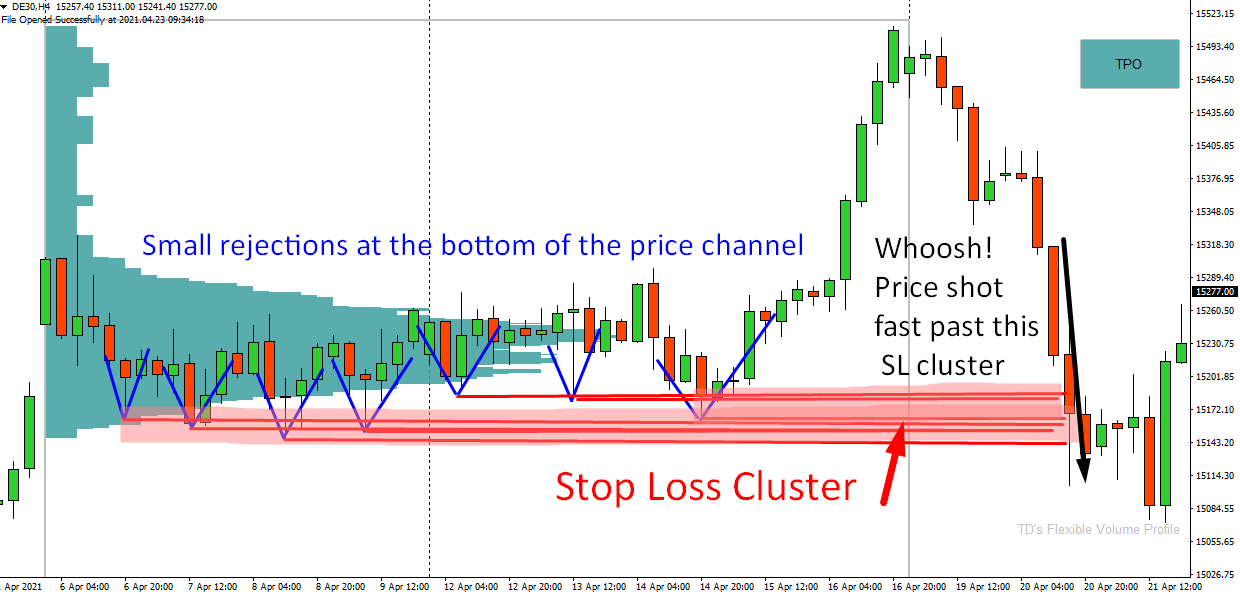
A phenomenon worth noticing with such “SL hunting” is that the price usually shoots rapidly through such zones. BOOM! Everybody is out 🙂 Often with slippage.
Why does the price shoot so fast through such areas? Because STOP LOSS order is a MARKET ORDER. This is important!
Stop Loss Order = Market Order
If you read the previous part of this article then you know that a Market Order means that you are able to quit (or enter) your trader NOW. The downside is that you may get a slippage, because NOW there might not be a big enough counter-party (exactly at your desired price level) to Buy what you Sell, or to Sell what you Buy.
Stop Loss Hunting
When there is a SL run, then all those people whose SL get hit enter a Market Order to quit their position. Market Orders are sort of catalyst that move the market. Those are aggressive orders.
This is the reason the price shoots fast past SL Cluster areas. SL clusters are catalysts and people often get slippage when their SL gets hit there.
Now, lets get back to that 15.250 level on DAX.
Stop Loss Hunting On DAX – EXAMPLE
Below this heavy volume area, there was a SL cluster. For this reason it was not a good idea to go Long from 15.250, because the SL cluster was right below it.
As you can see, the institutions recognized this SL cluster and they moved the price towards it. When the price hit this area it was quick. Whoosh! All those SL orders got hit. The fact that SL orders are Market Orders helped the price to shoot past this area fast.
Remember – Market Order means – I want in (or out) NOW!
So, that’s exactly why I don’t like trading Longs when there is such SL cluster below the potential Long entry level – when there is the “weak low“
You guys liked this article? I hope you did! Let me know your thoughts in the comments below.
Have a GREAT weekend and happy trading!
-Dale

How do you know there is a SL cluster? What do you look for?
Hello. You never know 100% sure. But there usually is a SL cluster below such “weak low/highs”. Maybe this article will help you understand weak/strong high/lows: https://www.trader-dale.com/price-action-strong-or-weak-highs-and-lows/
Dale i love this. I trade using tools where i see all retail stop loss clusters and combining that with your FVP is magical. Ican trade towards a cluster or off a cluster in reverse.
hi,
What tools do u use to see retail stop loss clusters please ?
Hi Jean, not sure if its ethical to post that here without prior consent from Dale. Lets see if he replies affirmatively on that 1st.
Hi guys, please send me name/link of the indi to my email and then if anybody needs the name I will tell them via email. Just shoot me a message okay? I am sorry I complicate stuff, but I want only “proven” links on the website.
Hi Dale.
Can you send me the article about tools that allow you to se SL clusters?
Thank you, Dany B.
Hi Dale, can I have the link of the tool if this is a proven one. Thank you!
Hi TraderDale
Can I get the link to see the retail stop loss levels. Thank you.
Hi Dale.
Can you send me the article about tools that allow you to se SL clusters?
Thank you, Gary B
Hi Dale, great article!! could you please send me the article about tools that allow you to se SL clusters? Thanks!!! Barbara
Hello, I would also like to know what tool to use to see the retail stop loss clusters please.
Charalambos, what tools allow you to see the SL Clusters? TY
Dale – Excellent Article, it seems to me much of the recent ES price action just revolves around running stops back and forth, on all time frames from 1-5 min, hourly, and even daily candles producing very whipsaw action.
Perhaps you could expound upon how this process takes places across the different time frames to complete a picture. Also, do you have any guesses/reasons why this type of price action has become so prevalent? (Lower Volumes, Liquidity Issues, Bank Overleverage/Over Lent Securities (Archegos/Melvin Capital), Explosion in Derivatives and Subsequent Balancing Issues)
Bluedog see my reply to Jean on same subject. If Dale ok’s it i will mention here.
thanks for this informations .. it’s really useful ..
agreed
Its almost like the big boys dont have enough people to trade with so they are “forcing” people to trade with them by creating seemingly wild back and forth price action, what was a great deal moments ago has completely reversed course with out pause, leaving everyone who blinked in shock and awe
Sometimes institutions will not run SLs if they know there is not much liquidity for them in those SL clusters to get their orders filled imo. I guess, FP tools help see if they are pushing into those areas to trigger the SLs.
Val its a fact that fake s/r is created and verified SEVERAL times to attract stop loss cluster liquidity. when the required volume is there then they WILL be targeted. But they also set up the opposite side too. There are two options after a stop hunt, 1) continuation to the next in same direction or a reverse action. Always depends on retails reaction to the MM moves.
Hi Charalambos/Dale
I have just started working on volume profile. Can you please let me know what tools allow you to see the SL Cluster as well the article if possible please?
Thank you in advance.
Hi dale and everyone,
how can we tell if that is not an accumulation of institution? I’m confused.
Thank you!
Hello, what you want to look for in this case, is not the heavy volume area, but the potential SL cluster below it. Those volumes could be institutions, but if there is a SL cluster below it, then in my experience the market tends to test it and take that liquidity.
Cheers!
Can you please let me know what tools allow you to see the SL Cluster as well the article if possible please?
Having to pick a trading course among all those out there is exausting. However, it looks to me that you knowleged is outstanding. Unlike other trainers, you have written two books where one can see a deepest understanding of the market.
However, every timne that I try to play with your set up number 2 on tradingview (Volume profile fixed range) I can not see such efectiveness from the tool.
So my question is, is there some thing else than ploting the tool everytime a see and strong up/down trend?
Thanks in advanced.
Thank you so much for this very clear explanation. Excellent article! And excellent website, too.
Dale,
What an enlightening article from you again.
I have recently discovered(as I mentioned before) that price action tends to fill the full range of a volume profile once it enters that VP.
An example of this is the same Dax chart that you use above; we notice that price entered the VP from below and moved up to reach the 1st heavy volume zone 14.600 (volume accumulation) then moved further up to 2nd heavy volume zone 15.250.
Now here is what causes the most confusion as everyone thinks/expects that price must bonce off from here 15.250 (Bullish Trap) by the Institutions…as I see it the full spectrum of the VP range had not been filled(Imbalance) so only once that imbalance had been filled the Institutions will bring the price back to 15.250 S/R zone bouncing off the full top of the VP to seek more liquidity zones.
Kindly assess my observation, Dale.
Thanks, Dale. Is a Good Tip to take in account.
Hello Dale,
Thanks for the great articles. can’t we go long after stop-loss hunting? so in this example wait until price goes below that area, and after stop-loss hunting is detected, go long. can you also send me the link of the tool that allow seeing SL clusters?
Hello Dale,
Thanks for the great articles.Can you also send me the link of the tool that allow seeing SL clusters?
Hi Dale
I would be very grateful if you could send me the link for the tool that allows you/me to see S/L clusters.
I can’t believe that such a tool exists and look forward to your explanation of how it works..
Many thanks in anticipation
Nigel